More Than One Line on the Same Graph (Grade 12 NSC Matric Mathematical Literacy): Revision Notes
More Than One Line on the Same Graph
What are multiple line graphs?
A multiple line graph displays two or more lines on the same set of axes to compare different but related quantities. This powerful tool allows you to see relationships between variables and identify important points where they intersect.
You will commonly encounter these graphs in financial contexts, such as:
- Comparing income and expenses
- Analysing costs and revenues
- Finding break-even points in business scenarios
Multiple line graphs are particularly valuable in business analysis because they allow you to visualise how different financial aspects of a business change over time or in relation to production levels.
Key terminology
The break-even point is the critical point where two lines meet on a graph. At this intersection, both quantities have exactly the same value. In business terms, this is where income equals total expenses - meaning no profit or loss occurs.
Understanding this concept is fundamental to business planning and financial analysis, as it helps determine the minimum performance needed for a business to avoid losses.
Essential concepts
When creating multiple line graphs, remember that:
- Both lines must represent the same two variables (for example, money against number of items)
- The lines can be plotted on the same axes because they share common units
- The intersection point provides valuable information for decision-making
- Each line typically represents a different aspect of the same situation
The power of multiple line graphs lies in their ability to show not just individual trends, but how different variables relate to each other. This comparative analysis is essential for making informed business decisions.
Step-by-step method
Step 1: Set up your data table
Create a table showing different scenarios with corresponding values for both quantities you want to compare.
Step 2: Calculate values using formulas
Use appropriate formulas to complete your table:
- Total expenses = Fixed costs + (Variable cost per unit × Number of units)
- Income = Selling price per unit × Number of units sold
Step 3: Plot both lines
- Use the same axes for both lines
- Label each line clearly
- Use different markers or colours to distinguish the lines
Step 4: Find the intersection point
- Identify where the lines cross
- Read the coordinates carefully
- This intersection represents the break-even point
Planning Your Graph: Always plan your scales carefully before plotting. Ensure your axes can accommodate the full range of values you expect, and choose scales that make the intersection point easy to identify and read accurately.
Worked example 1: Break-even analysis
Let's examine David's lamp business. He buys solar lamps for R45 each and sells them for R100 each. His monthly fixed costs are R12,000.
Worked Example: David's Solar Lamp Business
Given information:
- Purchase price per lamp: R45
- Selling price per lamp: R100
- Monthly fixed costs: R12,000
Formulas to use:
- Total expenses = R12,000 + (R45 × number of lamps)
- Total income = R100 × number of lamps
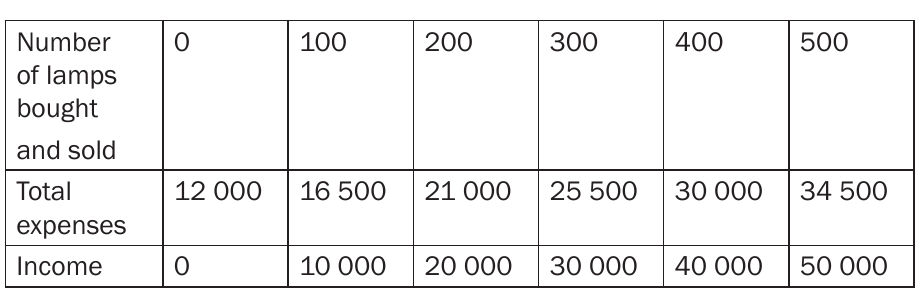
The completed data table shows how expenses and income change with the number of lamps sold.
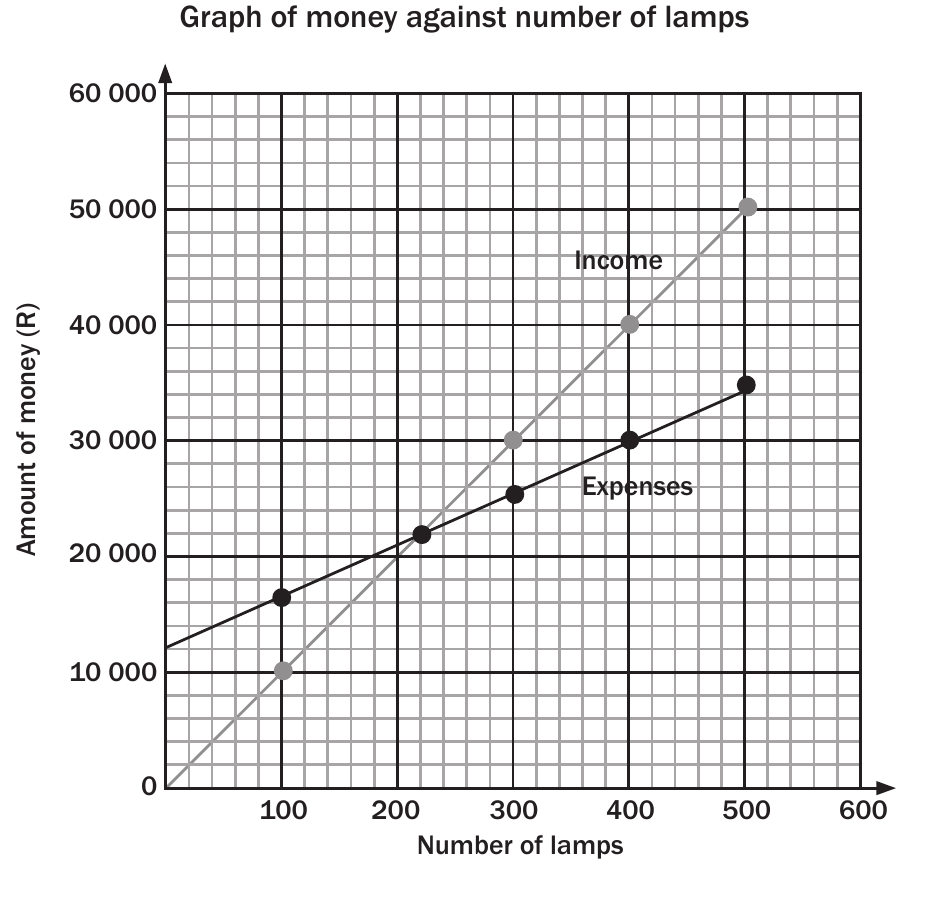
Analysis of results:
- The expenses line starts at R12,000 (fixed costs) and increases gradually
- The income line starts at zero and increases more steeply
- The lines intersect at the break-even point of 220 lamps
- At this point, both income and expenses equal approximately R22,000
Worked example 2: Transport costs
Consider Pieter's lift club scenario where he tracks petrol costs against passenger contributions over time.
Worked Example: Pieter's Lift Club Analysis
This scenario demonstrates how multiple variables can be tracked over time to identify profitable periods.
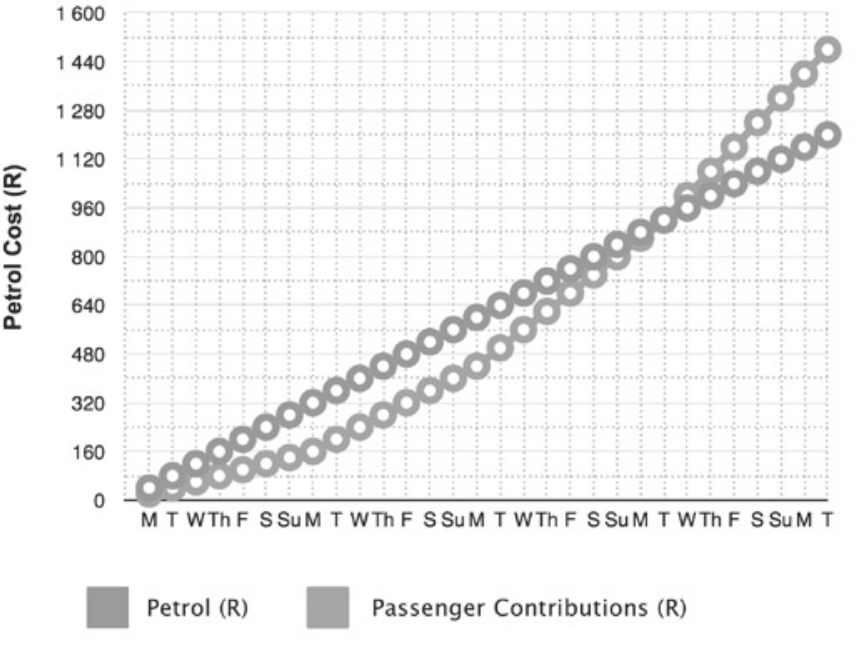
Key observations:
- Petrol costs increasing consistently over time
- Passenger contributions also rising but at a different rate
- Multiple intersection points where contributions match or exceed costs
- Periods of profit (when contributions exceed petrol costs)
Reading multiple line graphs effectively
When interpreting these graphs, follow this systematic approach:
- Identify each line - understand what each represents
- Find intersection points - these often represent break-even scenarios
- Compare gradients - steeper lines show faster rates of change
- Read coordinates accurately - use grid lines to find precise values
- Consider the context - relate mathematical results to real-world situations
The ability to read these graphs accurately is crucial for making informed business decisions and understanding financial relationships.
Reading Coordinates Precisely: Always use the grid lines as your guide when reading coordinates. If the intersection doesn't fall exactly on grid lines, estimate carefully by considering the position between grid lines. Round appropriately based on the context of the problem.
Business applications
Real-World Applications: Multiple line graphs help answer critical questions in business and economics:
- When will a business become profitable?
- How many items must be sold to cover costs?
- At what point do benefits outweigh expenses?
- How do different variables change relative to each other?
These graphs are used extensively in financial planning, market analysis, and strategic decision-making across all industries.
Common Exam Tips:
- Always label your lines clearly with a legend or direct labelling
- Use the grid to read coordinates accurately
- Show your working when calculating table values
- State your answer in context - don't just give numbers
- Check reasonableness - do your answers make business sense?
Remember: Examiners look for clear, methodical approaches and answers that make sense in the given context.
Typical Mistakes to Avoid:
- Mixing up which line represents which quantity
- Reading coordinates incorrectly from the graph
- Forgetting to include fixed costs in expense calculations
- Not labelling axes or lines properly
- Giving answers without appropriate units
These mistakes can cost valuable marks, so always double-check your work and ensure your graph is properly labelled.
Key Points to Remember:
- Multiple line graphs compare two related quantities on the same axes
- The break-even point occurs where two lines intersect and have equal values
- Total expenses include both fixed costs and variable costs
- Intersection points provide crucial information for business decisions
- Always label your graphs clearly and read coordinates accurately from the grid