Reading Information from a Graph (Grade 12 NSC Matric Mathematical Literacy): Revision Notes
Reading Information from a Graph
Graphs are powerful visual tools that help us understand relationships between two quantities. When you encounter a graph, the key is to approach it systematically and extract the important information step by step.
Understanding graph components
Every graph has essential parts that you need to identify before reading any values.
Before attempting to read any values from a graph, you must first familiarise yourself with its basic components. This foundational step will ensure accurate interpretation of the data presented.
Axes are the foundation of any graph - the horizontal line is called the x-axis and the vertical line is called the y-axis. Each axis represents a different quantity or variable.
The scale tells you what each grid square or marking represents. This is crucial information because without understanding the scale, you cannot read accurate values from the graph. Always look for scale indicators, which are often written near the axes or in annotations on the graph.
Identifying variables
Understanding the difference between independent and dependent variables is essential for correctly interpreting any graph. This concept forms the foundation of graph reading skills.
Graphs show relationships between an independent variable and a dependent variable. The independent variable is the quantity that you can control or choose - it goes on the x-axis (horizontal). The dependent variable is the quantity that changes as a result of the independent variable - it goes on the y-axis (vertical).
In many real-world situations, the dependent variable depends on or is caused by changes in the independent variable. For example, when buying items, the total cost depends on how much you buy.
Reading values from graphs
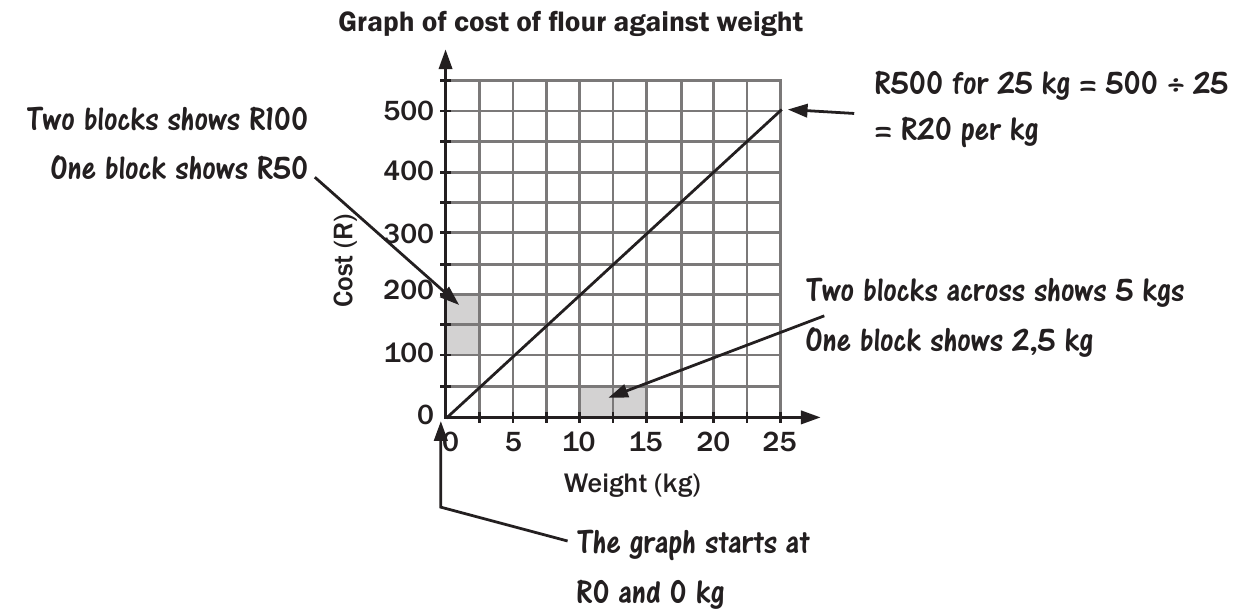
Let's examine this graph showing the relationship between flour weight and cost. Here's how to read information systematically:
Step 1: Identify the scale
- On the y-axis (cost): Two blocks represent R100, so one block represents R50
- On the x-axis (weight): Two blocks represent 5 kg, so one block represents 2.5 kg
Step 2: Identify the variables
- Independent variable: Weight (kg) - this is what the customer chooses
- Dependent variable: Cost (R) - this depends on how much flour is purchased
Step 3: Find the starting point The graph starts at the origin (0,0), meaning R0 for 0 kg. This makes sense because if you buy no flour, you pay nothing.
Step 4: Read specific values From the graph, you can see that 25 kg of flour costs R500. You can verify this by following the line to where x = 25 kg and reading the corresponding y-value.
Calculating unit rates
Unit rate tells you the cost per single unit. From the graph, you can calculate:
This means flour costs R20 for every kilogramme purchased.
Recognising linear relationships
Linear relationships are among the most common and important patterns you'll encounter in graphs. Recognising these patterns helps predict values and understand the consistency of relationships between variables.
This graph shows a linear relationship because it forms a straight line. This indicates direct proportion - as the weight doubles, the cost doubles too. The relationship is consistent throughout the graph.
Key features of linear relationships:
- The graph forms a straight line
- The relationship between variables is constant
- If one variable increases by a certain amount, the other increases proportionally
Worked example: reading graph values
Worked Example 1: Using the flour cost graph, find the cost of 10 kg of flour.
Solution:
- Locate 10 kg on the x-axis
- Draw a vertical line up until it meets the graph line
- From that point, draw a horizontal line to the y-axis
- Read the value: R200
Worked Example 2: How much flour can you buy for R150?
Solution:
- Locate R150 on the y-axis
- Draw a horizontal line across until it meets the graph line
- From that point, draw a vertical line down to the x-axis
- Read the value: 7.5 kg
Worked Example 3: Verify the unit rate using different points.
Solution: Using the point (10 kg, R200):
✓
This confirms our earlier calculation.
Exam tips for graph reading
Essential Exam Strategies
Following a systematic approach will help you avoid common mistakes and ensure accurate graph reading in exam situations.
- Always read the title first to understand what the graph represents
- Check both axes labels and scales before attempting to read values
- Look for the starting point - does the graph pass through the origin?
- When reading values, use a ruler or straight edge to ensure accuracy
- Double-check your answers by using the unit rate to verify calculations
Common exam traps
Watch Out For These Common Mistakes
Many students lose marks on graph questions due to these preventable errors. Being aware of these traps will help you avoid them.
- Scale misreading: Always check what each grid square represents
- Axis confusion: Remember x is horizontal (independent), y is vertical (dependent)
- Interpolation errors: When reading between grid lines, estimate carefully
- Unit mistakes: Make sure your answer includes the correct units
Key Points to Remember:
- Identify the scale on both axes before reading any values from a graph
- Independent variables go on the x-axis, dependent variables go on the y-axis
- Linear graphs show direct proportional relationships where the unit rate remains constant
- Unit rates can be calculated by dividing the total dependent variable by the total independent variable
- Always include units in your final answers and check that your values make sense in the real-world context