Reading the Scale of a Graph (Grade 12 NSC Matric Mathematical Literacy): Revision Notes
Reading the Scale of a Graph
What is a graph scale?
A graph scale is the system that shows what each space or division on a graph represents. When you analyse any graph, the very first thing you must do is check the scale on both axes. The scale tells you the numerical value that each space, line, or block on the graph represents.
Think of a graph scale like the markings on a ruler - each small division has a specific value, and understanding this value is essential for reading the graph accurately.
Why is reading scales important?
Reading scales correctly is crucial because:
- It allows you to find exact values from the graph
- It helps you interpret data accurately
- It prevents costly mistakes in exams
- It enables you to compare different parts of the graph meaningfully
Exam tip: Always spend a few moments studying the scale before attempting to answer any questions about a graph.
Understanding different types of scales
Vertical axis (y-axis) scales
The vertical axis typically shows the main measurement being tracked. In many mathematical literacy contexts, this might be percentages, amounts of money, or quantities.
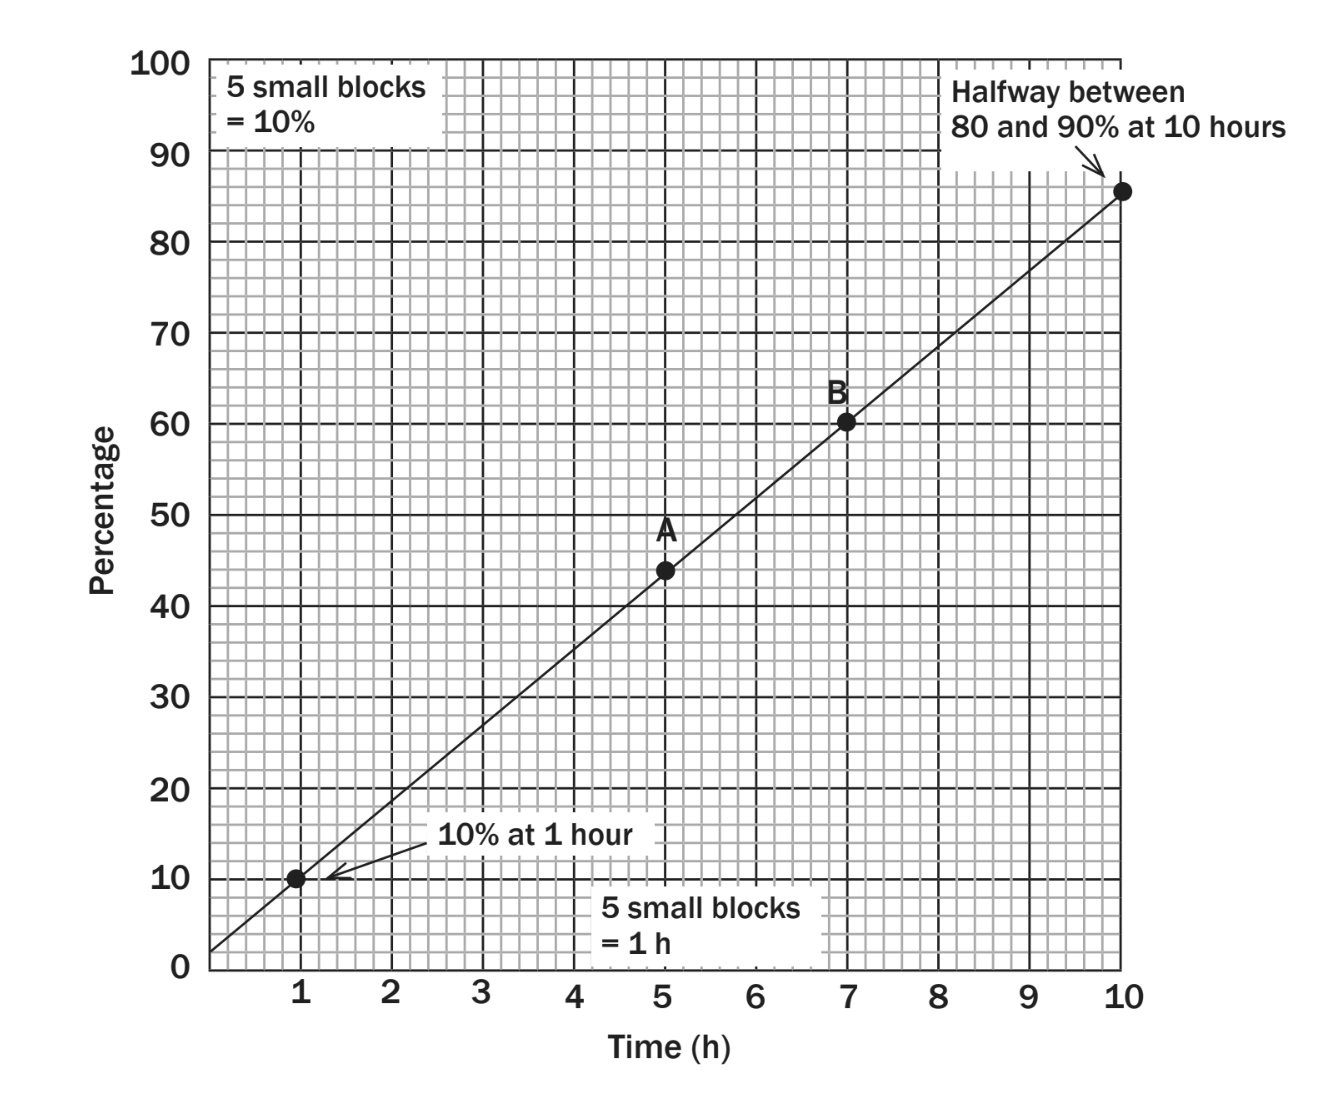
From this graph, you can see that 5 small blocks equal 10% on the vertical axis. This means:
- Each small block = 2%
- Each large block (containing 5 small blocks) = 10%
Horizontal axis (x-axis) scales
The horizontal axis usually represents time or another independent variable.
In this example, 5 small blocks equal 1 hour on the horizontal axis. Therefore:
- Each small block = 0.2 hours (or 12 minutes)
- Each large block = 1 hour
Working with fractional and decimal scales
Sometimes scales don't work in neat whole numbers. You need to calculate what each small division represents:
Example Calculation:
If 5 small blocks = 10%, then:
- 1 small block =
- Half a small block =
Step-by-step method:
- Find the value of the large division
- Count how many small divisions fit into the large division
- Divide the large value by the number of small divisions
- This gives you the value of each small division
Reading between marked values (interpolation)
Often, you need to find values that fall between the marked lines on the graph. This is called interpolation.
Key technique: Look for halfway points between major scale markings.
For example, if you need to find a value halfway between 80% and 90%, you know it must be 85%. Count the small blocks to verify your reading.
Worked examples
Example 1: Reading exact values
From the graph, at 1 hour, the percentage is 10%. This point lies exactly on grid lines, making it easy to read.
Example 2: Reading intermediate values
To find the percentage at 10 hours, look where the line crosses the 10-hour mark. The graph shows this is halfway between 80% and 90%, giving us 85%.
Example 3: Finding coordinates of marked points
Point A appears to be at 5 hours and approximately 44%. Point B is at 7 hours and approximately 60%.
Method:
- Draw an imaginary vertical line from the point down to the x-axis
- Draw an imaginary horizontal line from the point across to the y-axis
- Read the values where these lines intersect the axes
- Use the scale to convert grid positions to actual values
Common exam mistakes to avoid
Common Mistakes to Avoid:
- Not checking the scale first - Always examine what each division represents
- Mixing up axes - Remember which axis is which
- Estimating instead of counting - Count blocks carefully rather than guessing
- Forgetting about small blocks - Pay attention to the smaller divisions
- Reading the wrong scale - Some graphs have multiple scales
Exam tips
Exam Success Strategies:
- Use a ruler or straight edge to help you read values accurately from the grid
- Start with easy points that fall exactly on grid lines to check your understanding
- Work systematically from one axis to the other
- Double-check your scale reading before answering questions
- Show your working when calculating intermediate values
Key Points to Remember:
- Always examine the scale on both axes before reading any values from a graph
- Count small blocks carefully - they add up to create the larger scale divisions
- Use interpolation to find values between marked grid lines
- Each small division has a specific numerical value that you can calculate
- Practice makes perfect - the more graphs you read, the faster and more accurate you'll become