Using a Two-Way Table to Show Combined Outcomes (Grade 12 NSC Matric Mathematical Literacy): Revision Notes
Using a Two-Way Table to Show Combined Outcomes
What is a two-way table?
A two-way table (also called a contingency table) is a powerful tool for organising and displaying the outcomes of two events happening together. Think of it as a grid where one event's outcomes are shown in rows and the other event's outcomes are shown in columns. Each cell in the table represents a possible combined outcome from both events.
Two-way tables work similarly to tree diagrams but present information in a more organised, visual format that makes calculations easier to perform.
Two-way tables are particularly useful because they provide a clear visual representation of all possible outcomes when two events occur simultaneously, making probability calculations much more straightforward than other methods.
Basic structure of a two-way table
The fundamental structure involves:
- Rows: Represent the outcomes of the first event
- Columns: Represent the outcomes of the second event
- Cells: Show the combined outcomes or frequencies
- Totals: Usually included at the edges to show row and column sums
Simple example: Coin tossing
Let's start with a basic example of tossing a coin twice. Each toss can result in either heads (H) or tails (T).
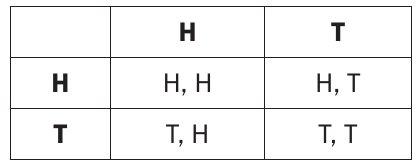
This table shows all possible outcomes when tossing a coin twice:
- First coin H, second coin H: (H,H)
- First coin H, second coin T: (H,T)
- First coin T, second coin H: (T,H)
- First coin T, second coin T: (T,T)
Notice there are 4 possible combined outcomes in total.
Worked example 1: Pet ownership survey
Let's examine a real-world example where data has been collected about learners' pets.
Worked Example: Pet Ownership Survey
Problem: Pumaza surveys 30 learners about their pet ownership:
- 5 learners have both a cat and a dog
- 6 learners have a cat but not a dog
- 12 learners have a dog but not a cat
- 7 learners have neither a cat nor a dog
Solution: We can organise this information in a two-way table:
| Has a dog | Does not have a dog | |
|---|---|---|
| Has a cat | 5 | 6 |
| Does not have a cat | 12 | 7 |
This table clearly shows the relationship between cat ownership and dog ownership among the 30 learners surveyed.
Worked example 2: Rolling two dice
When rolling two dice (a blue die and a red die), we can create a comprehensive table showing all possible outcomes.
Worked Example: Rolling Two Dice
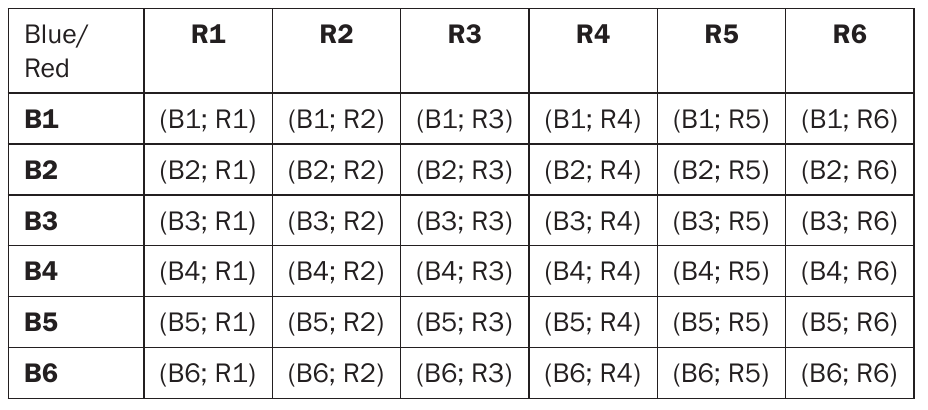
Setting up the table:
- Rows represent the blue die outcomes (B1, B2, B3, B4, B5, B6)
- Columns represent the red die outcomes (R1, R2, R3, R4, R5, R6)
- Each cell shows the combined outcome, such as (B1; R1)
Key calculations:
- Total outcomes: possible combinations
- Probability of any specific outcome:
- Probability of rolling a 5 on the blue die:
Example probability questions:
- Chance of rolling a 3 on blue die (any red):
- Chance of rolling (B2; R4):
- Chance of getting a 1 and a 2 (either die):
Worked example 3: Gift pack probability
Consider a practical scenario involving gift packs for toddlers.
Worked Example: Gift Pack Probability
The data:
| Item | Green | Red | Yellow | Total |
|---|---|---|---|---|
| Coloured clay | 10 | 15 | 5 | 30 |
| Colouring book and crayons | 7 | 20 | 3 | 30 |
| Mini chalkboard and chalk | 12 | 25 | 8 | 45 |
| Pop-up story book | 9 | 19 | 5 | 33 |
| Total | 38 | 79 | 21 | 138 |
Probability calculations:
-
Probability of selecting a green pack:
-
Probability of selecting a yellow pack:
-
Probability of red mini chalkboard:
-
Probability of green coloured clay:
Key steps for probability calculations
When working with two-way tables to calculate probabilities, follow these systematic steps:
Essential Steps for Two-Way Table Probability Calculations
- Identify the favourable outcomes from the table
- Count the total number of outcomes (usually the grand total)
- Write the probability as a fraction:
- Simplify the fraction where possible
- Convert to decimal or percentage if required
Common exam tips
Critical Exam Success Tips
- Always check your totals: Row totals and column totals should add up to the grand total
- Read questions carefully: Make sure you understand what specific outcome is being asked for
- Simplify fractions: Examiners expect fractions in their lowest terms
- Show your working: Even for simple calculations, demonstrate your method
- Double-check your counting: It's easy to miscount cells in larger tables
Key Points to Remember:
- A two-way table organises combined outcomes from two events in rows and columns
- Each cell represents a possible combination of outcomes from both events
- Total outcomes equal the number of filled cells (or grand total for frequency tables)
- Probability = favourable outcomes ÷ total outcomes
- Always simplify fractions and check your arithmetic carefully