Using Tree Diagrams (Grade 12 NSC Matric Mathematical Literacy): Revision Notes
Using Tree Diagrams
What are tree diagrams?
A tree diagram is a visual tool that helps us organise and display all the different results that could happen in a probability experiment. Tree diagrams make it easy to see every possible outcome and calculate the likelihood of each result occurring.
The structure resembles a tree with branches spreading out from a starting point. Each branch represents a pathway leading to a specific outcome, and the probability of that outcome is written along the branch.
Tree diagrams are particularly useful because they provide a systematic way to ensure you don't miss any possible outcomes when solving probability problems. They also make complex probability calculations much clearer by showing the visual connections between different events.
Simple tree diagrams
Single event examples
When we conduct a simple experiment with one action, tree diagrams help us visualise all possibilities clearly.
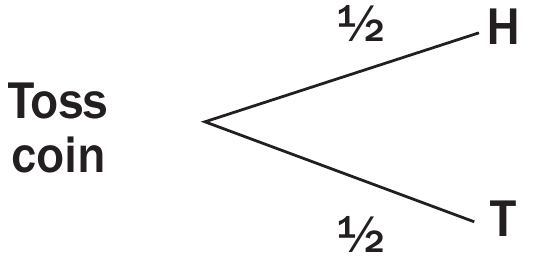
Coin toss example: When flipping a fair coin, there are two equally likely outcomes. The probability of getting Heads is and the probability of getting Tails is also .
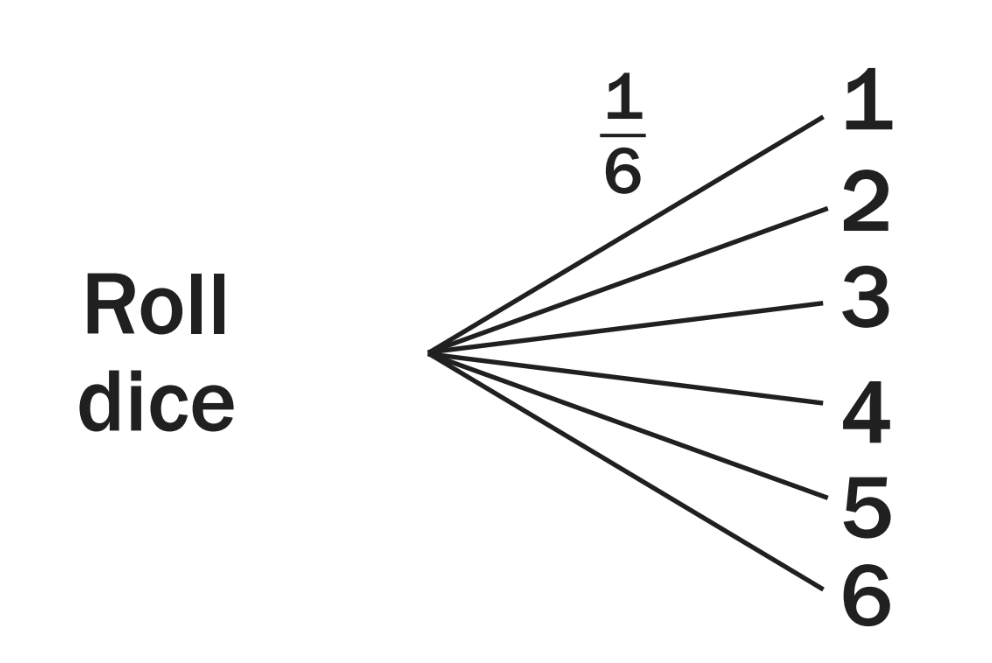
Dice roll example: When rolling a standard six-sided die, there are six possible outcomes (numbers 1 through 6). Each number has an equal probability of of appearing.
Reading probabilities from branches
Each line extending from the starting point shows the probability fraction or decimal. The sum of all probabilities from any branching point must equal 1 (or 100%), since one of the outcomes must definitely occur.
Combined events in tree diagrams
Multiple events together
When we combine two or more experiments, tree diagrams become particularly powerful for showing all possible combinations. The diagram extends with additional levels of branches.
Key principle: For combined events, we multiply the probabilities along each complete path from start to finish to find the probability of that specific combination.
Calculating probabilities for combined outcomes
For independent events (where one result doesn't affect the other):
- Individual outcome probability = multiply probabilities along that path
- Multiple outcomes probability = add the probabilities of all relevant paths
Worked examples
Worked Example 1: Coin and dice combination
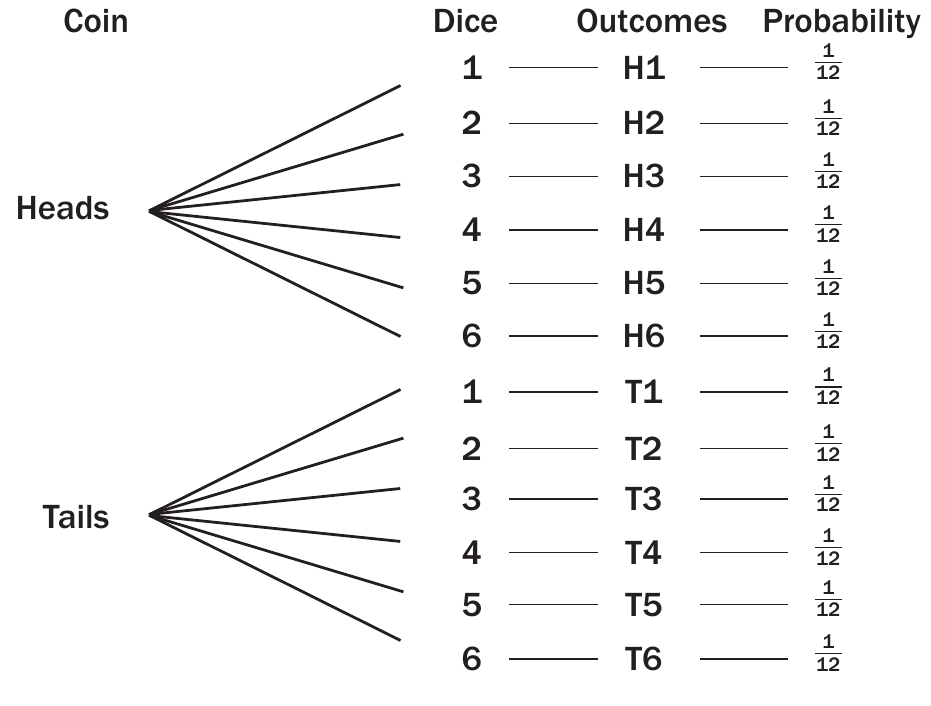
When tossing a coin and rolling a die together:
- Total possible outcomes: 12 (H1, H2, H3, H4, H5, H6, T1, T2, T3, T4, T5, T6)
- Probability of each outcome: (since )
- Probability as decimal: or 8%
Calculating specific combinations:
- Getting an even number on the dice: 6 favourable outcomes out of 12
- Probability = = 0.5 or 50%
Worked Example 2: Gender combinations in families
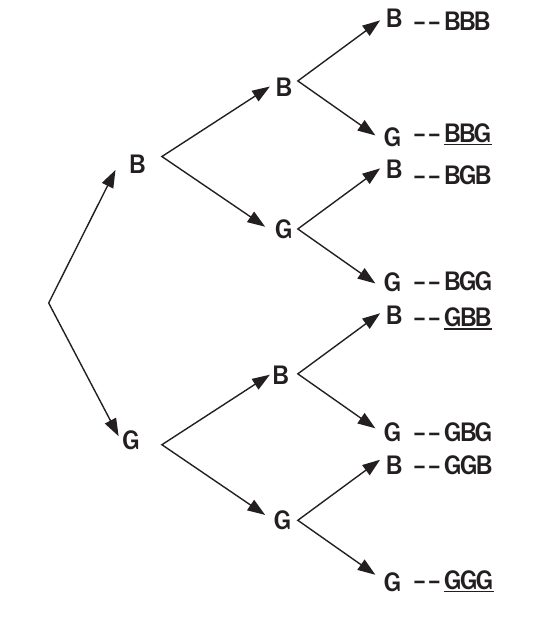
For a family planning three children, each child can be either a boy (B) or girl (G):
- Total possible outcomes: 8 (BBB, BBG, BGB, BGG, GBB, GBG, GGB, GGG)
- Probability of each outcome: = 0.125 or 12.5%
Calculating "at least" scenarios:
- "At least 2 girls" means 2 or 3 girls
- Favourable outcomes: BGG, GBG, GGB, GGG = 4 outcomes
- Probability = = 0.5 or 50%
Worked Example 3: Real-world applications
Tree diagrams work for practical situations like sandwich combinations:
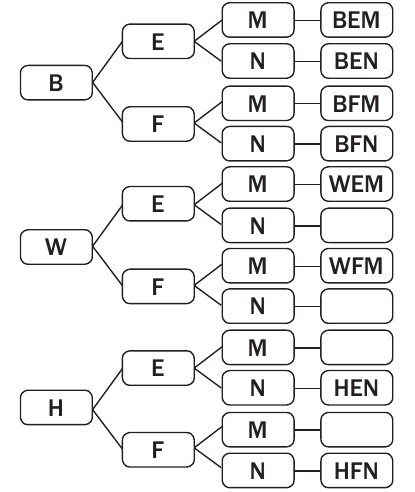 The sandwiches are made from an equal number of white (W), brown (B) and whole-wheat (H) loaves of bread. The fillings used for the sandwiches are egg (E) or fish (F), with(M) or without (N) mayonnaise.
This shows how different choices (bread type, filling, condiments) combine to create various final products. Each complete path from left to right represents one unique sandwich combination.
Key calculations and formulas
For any tree diagram:
- Probability of a specific path = multiply all probabilities along that path
- Sum of all probabilities at any branch point = 1
- Total number of outcomes = multiply the number of options at each stage
Common probability expressions:
- Fraction form:
- Decimal form: divide the fraction
- Percentage form: multiply decimal by 100
Exam tips and common mistakes
What examiners look for:
- Clear identification of all possible outcomes
- Correct probability calculations using multiplication along paths
- Proper fraction simplification and percentage conversions
- Understanding of "at least" and "at most" language
Common pitfalls to avoid:
- Forgetting to multiply probabilities along complete paths
- Confusing "at least 2" with "exactly 2"
- Not simplifying fractions in final answers
- Missing outcomes when listing possibilities
Exam strategy:
- Always list all outcomes systematically
- Show your working for probability calculations
- Convert between fractions, decimals, and percentages as requested
- Double-check that your total outcomes match your tree diagram
Remember!
Key Points to Remember:
-
Tree diagrams help visualise all possible outcomes - they show every different result that could happen in an experiment
-
Multiply along paths, add across outcomes - to find the probability of a specific combination, multiply the probabilities along that path; to find the probability of multiple combinations, add their individual probabilities
-
Each branch point probabilities sum to 1 - this helps you check your work and identify missing branches
-
Independent events multiply - when one event doesn't affect another, multiply their individual probabilities to find combined probabilities
-
"At least" means that number or more - be careful with language in probability questions, as "at least 2" includes 2, 3, 4, etc.