Population Genetics (HSC SSCE Biology): Revision Notes
Population Genetics
Introduction to population genetics
Population genetics is a branch of biology that studies how genetic composition changes within groups of organisms over time. This field directly addresses how we can compare genetic similarities and differences both within species and between different species. Scientists use population genetics to understand evolutionary processes and predict how populations might adapt to changing environments.
The study of population genetics combines two fundamental biological principles: Mendelian genetics (how traits are inherited) and Darwinian evolution (how species change over time). This integration allows scientists to understand both small-scale and large-scale evolutionary changes.
By examining how allele frequencies shift in populations, researchers can observe both microevolution (relatively rapid changes occurring over short time periods) and macroevolution (gradual changes occurring over extended periods).
Population geneticists gather quantitative data by measuring gene and allele frequencies within real populations. They then apply mathematical models to predict how external factors will influence these frequencies. This approach allows scientists to test their conclusions against empirical data obtained through observation and experimentation, enabling them to draw valid conclusions about patterns of genetic variation within populations over time.

Key concepts in population genetics
Gene pool and genetic diversity
The gene pool represents the complete collection of all genes and their alleles present within a population at any given time. Think of it as the total genetic resource available to that population. The larger and more varied the gene pool, the greater the population's potential to adapt to environmental changes.
Genetic diversity refers to the total range of genetic characteristics in the genetic makeup of a species. This diversity depends on genetic variability, which is the tendency of individual genetic traits within a population to vary from one organism to another.
Species with greater genetic diversity possess a greater potential to adapt to changing conditions and ultimately survive. This is why maintaining genetic diversity is crucial for conservation efforts and species survival.
Understanding these concepts is crucial because populations differ in the extent of their genetic variation for particular genes. By measuring the degree of genetic variation within a population over time, scientists can make predictions about which populations are more likely to flourish, evolve into new species, or face extinction.
Factors affecting allele frequency
Population geneticists investigate various factors that cause changes in allele frequency within populations. For example, they might study how temperature changes (acting as selective pressure) affect the allele frequency in a particular population. They compare allele frequencies in a stable population with Mendelian inheritance (a population in equilibrium) with allele frequencies in real populations exposed to selective pressures.
External factors other than natural selection that cause changes to allele frequency include:
- Gene flow (movement of alleles between populations)
- Genetic drift (random changes in allele frequencies)
- Natural selection (differential survival based on traits)
Genetic variation and frequencies of characteristics
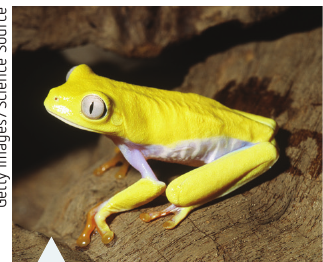
Genetic variability within a population is essential for evolution by natural selection to occur. Microevolution can be studied by examining changes in the frequency of alleles in a population over several generations. Consider a practical example: skin colour in the red-eyed tree frog Agalychnis callidryas is determined by a gene with two alleles: (normal colour) and (albino).

Types of frequencies
Genetic variability in a population can be determined by analysing the relative proportion (ratio or percentage) of a given phenotype, genotype, or allele within that population.
Three Main Types of Frequencies:
Understanding these three different types of frequencies is essential for analyzing genetic variation in populations. Each provides a different perspective on the genetic makeup of a population.
1. Phenotypic frequency: This measures the proportion of individuals displaying a particular observable trait. For example, in a population of frogs, you might count how many display normal colouring versus albino colouring.
2. Genotypic frequency: This measures the proportion of individuals with specific genetic combinations. For instance, how many frogs are homozygous dominant (), heterozygous (), or homozygous recessive ().
3. Allele frequency: This measures how common a particular allele is within a population. Many genes are bi-allelic, meaning they have two variants or two possible alleles within a population (for example, and for height in pea plants).
Calculating allele frequency
Allele frequency can be calculated by counting the number of copies of an allele in a population and then dividing by the total number of copies of all alleles of the gene:
Some genes may be multi-allelic, having more than two allele variants per gene. An example is the gene for ABO blood groups. In this case, to calculate the total number of copies of the gene, we would need to add together all the different alleles (three for ABO blood groups) within the population.
Worked example: frequency calculations in tree frogs
Let's examine how to measure changes in allele frequency over time using a hypothetical population of tree frogs. We'll compare the first generation with a population seven generations later.

Worked Example: Calculating Phenotypic Frequencies
To calculate phenotypic frequencies, count the number of individuals displaying each phenotype, then divide by the total number of individuals in the population. Round to two decimal places for clarity.
Generation 1:
- Normal frogs:
- Albino frogs:
Generation 7:
- Normal frogs:
- Albino frogs:
Worked Example: Calculating Genotypic Frequencies
Count the number of each genotype in each generation, then divide by the total number of individuals.
Generation 1:
- :
- :
- :
Generation 7:
- :
- :
- :
Worked Example: Calculating Allele Frequencies
For allele frequencies, count each copy of the allele. Remember that homozygous individuals ( or ) contribute two copies, while heterozygous individuals () contribute one copy of each allele. The total number of alleles is twice the number of individuals.
Generation 1:
- :
- :
Generation 7:
- :
- :
Interpreting the results
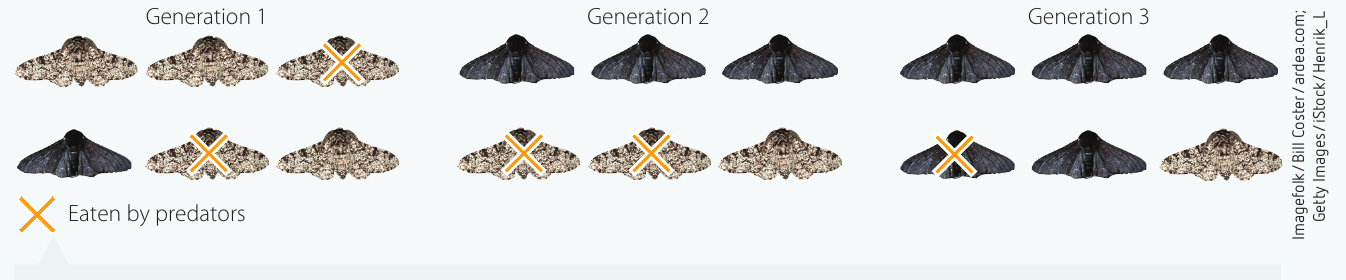
In this example, we observe a significant shift in allele frequencies between generations. The frequency of the (albino) allele increased from 0.29 to 0.54, while the (normal colour) allele decreased from 0.71 to 0.46.
This suggests that yellow colouring might provide a selective advantage, perhaps making frogs less visible to predators or attracting more mates. Such dramatic shifts in allele frequencies indicate strong selective pressure acting on the population.
Population geneticists might develop a hypothesis such as: "If a frog is albino, then its rate of capture by predators will be less frequent." This hypothesis could then be tested through controlled experiments or field observations.
Applications of frequency data
Blood group frequency studies
Examining the frequencies of blood groups in humans around the globe reveals significant differences between people from different countries and ethnic origins. This data has practical applications for organisations like the Red Cross, which coordinates blood donations worldwide.
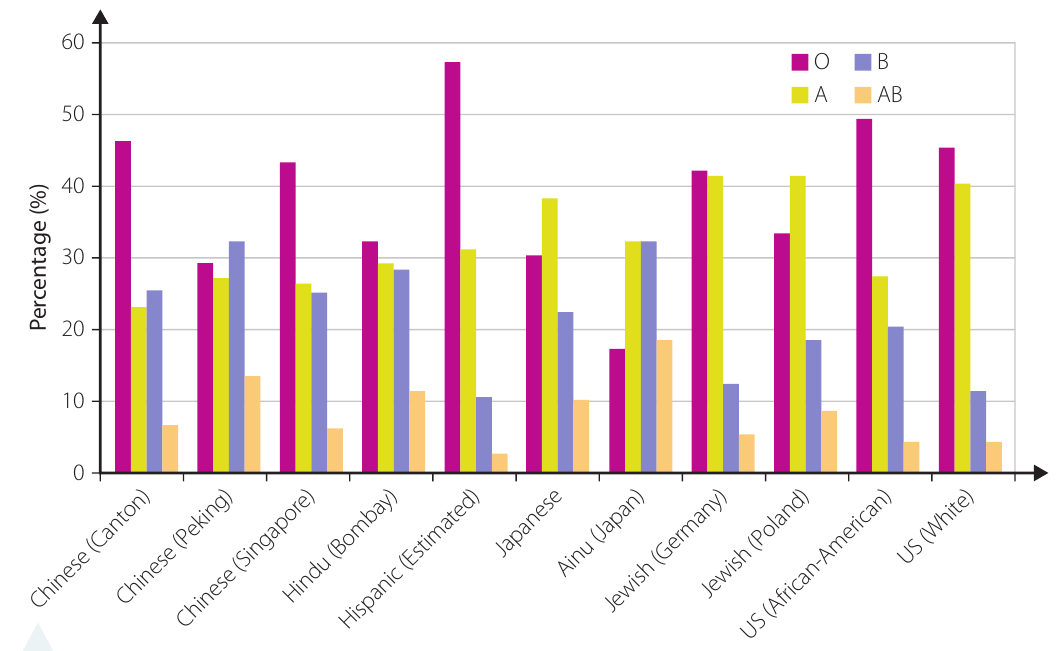
The bar chart shows blood type distribution across different populations. We can observe that:
- Type O blood is generally the most common across most populations
- Type AB blood is consistently the least common
- Significant variations exist between populations (for example, Hispanic populations show approximately 57% type O blood)
- Different ethnic groups show distinct patterns of blood type distribution
Practical Applications of Blood Group Frequency Data:
This information is valuable for:
- Planning blood bank supplies in different regions
- Understanding human migration patterns
- Studying evolutionary relationships between populations
- Ensuring adequate blood supplies for medical emergencies
Single nucleotide polymorphisms
What are SNPs?
In genetics, the term polymorphism refers to individuals with different phenotypes. The word literally means "many forms" (poly = many, morph = form). Polymorphisms usually arise as a result of mutations—errors in DNA replication.
A single nucleotide polymorphism (SNP, pronounced "snip") is like a typing error in DNA, where one nucleotide is replaced by another. SNPs usually arise during DNA replication, where a single nucleotide is incorrectly inserted, creating an error in the DNA sequence at a particular location on a chromosome.
To be classified as a SNP rather than simply a mutation, this altered DNA sequence must occur in at least one per cent of the population. This frequency threshold distinguishes common genetic variations (SNPs) from rare mutations.
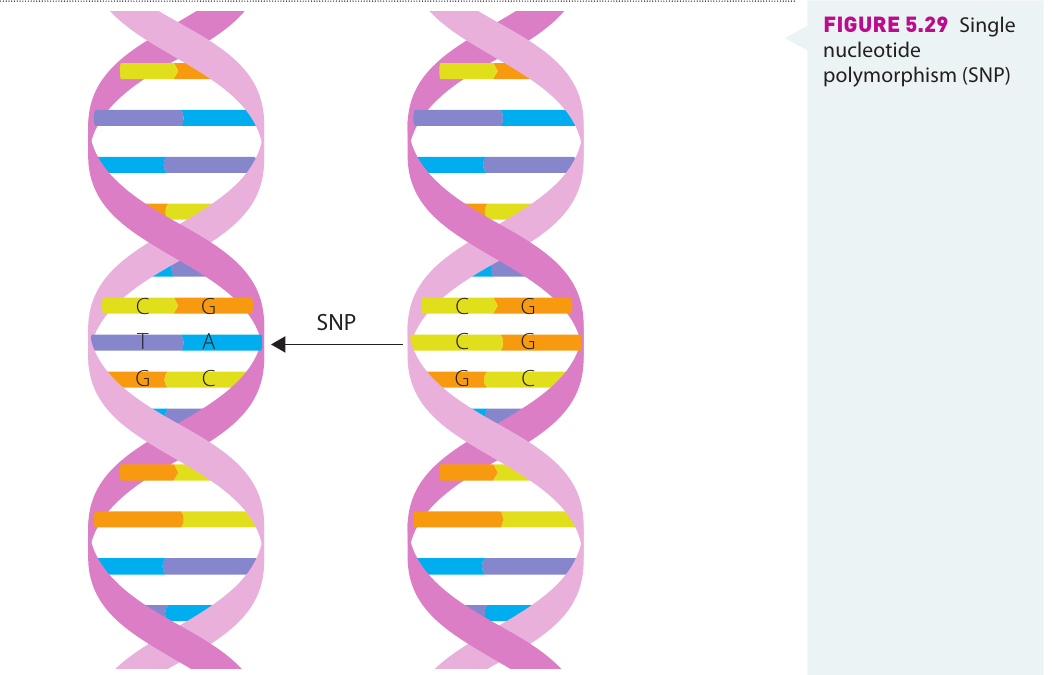
The diagram shows two DNA double helices side by side. In the left helix, there is a T-A base pair at a specific location, while in the right helix, there is a C-G base pair at the same position. This single nucleotide difference represents a SNP.
Importance of SNPs in genetic studies
Variations in organisms, including SNPs, may be associated with phenotypic changes, such as:
- Changes in appearance
- Differences in enzyme functioning
- Variations in disease susceptibility
- Different responses to drugs
However, most SNPs occur in non-coding regions of DNA and do not lead to observable differences. Despite this, SNPs are extremely valuable as genetic markers for distinguishing individuals and populations.
A genetic marker can be defined as an identified sequence of DNA at a known site (locus) on a chromosome. Examples include SNPs and STRs (short tandem repeats). Individuals within a population show great variation in the genetic markers they have on their DNA, giving scientists a relatively easy way to distinguish individuals. For example, there are approximately 10 million known SNPs in the human genome.
Applications of SNPs
Some genetic markers are associated with specific traits or disorders, but do not necessarily cause them. Applications of SNP studies include:
- Disease indicators: SNPs can be associated with increased risk for certain diseases
- Family lineage: Establishing genetic relationships between individuals
- Evolutionary studies: Investigating evolutionary relatedness between species
- Personalised medicine: Determining how individuals might respond to different drugs
Progress in DNA manipulation techniques and advances in bioinformatics technology (computer analysis of biological data) has allowed very large numbers of SNP markers to be identified in particular regions of chromosomes.
Genome-wide association studies
Understanding GWAS
In genome-wide association studies (GWAS), computer technology is used to rapidly scan genetic markers across the genomes (complete sets of DNA) of many people to find genetic variations associated with a particular disease. A data bank of SNP genetic markers is currently being built to record associations between the presence of specific markers and particular diseases or disorders.
Scientists look for SNPs that occur in higher frequencies in people with a particular disease, compared with people who do not have the disease. The SNPs that occur in a higher frequency are said to be "associated" with that disease. Advances in technology allow hundreds or thousands of SNPs to be analysed at the same time, which is much faster and cheaper than sequencing whole genomes.
By studying SNPs in groups of 25-50 people, scientists are able to detect polymorphisms occurring in 1 to 3 per cent of the population with approximately 95 per cent confidence. This demonstrates the power of modern genomic analysis techniques.
Haplotypes
Genome-wide association studies are based on the presence of a group of SNP markers (called a haplotype) associated with a trait, rather than trying to link an individual SNP with a trait. A haplotype consists of adjacent SNPs that are inherited together from one parent.
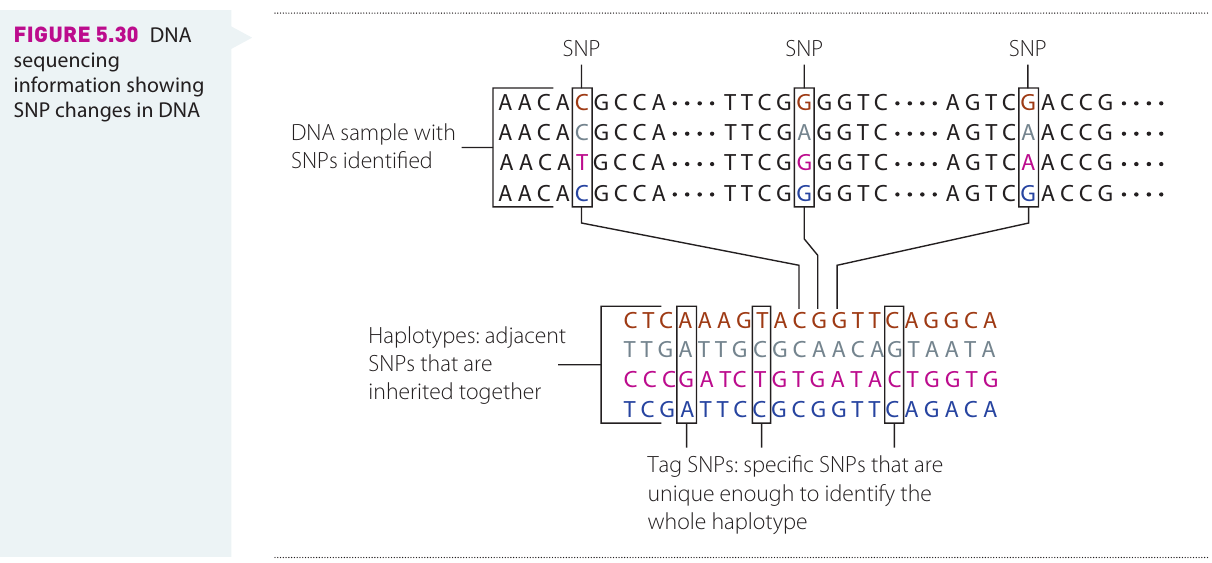
The diagram illustrates how multiple SNPs located close together on a chromosome are inherited as a unit.
Scientists identify "tag SNPs"—specific SNPs that are unique enough to identify the whole haplotype. This approach is more reliable because it accounts for the fact that SNPs close together on a chromosome tend to be inherited together.
The HapMap project
The HapMap project (short for "haplotype mapping") is an international collaborative effort that involves scientists cataloguing markers inherited together on chromosomes. These markers include SNPs and short tandem repeats (STRs), creating databases that can be searched to examine common genetic variants in detail.
Haplotype analysis to date has shown associations between particular SNPs and human diseases, including:
- Osteoporosis
- Asthma
- Diabetes
- Alzheimer's disease
Limitations of SNP data
While SNP data is extremely useful, scientists must be aware of certain limitations:
Key Limitations to Consider:
- Region selection: Data is reliable only if the regions selected are fairly evenly distributed throughout the genome
- Marker proximity: Genetic markers that are closer together give more accurate data
- Crossing over: During meiosis, crossing over can separate SNPs that were originally on the same chromosome
- Coverage: Smaller regions of the genome showing polymorphisms can answer many biological questions, but may not represent the entire genome
Scientists carefully consider these limitations when designing studies and interpreting results.
SNPs versus whole-genome sequencing
The terms "genotyping" and "sequencing" have slightly different meanings. Genotyping involves identifying genetic variations in individuals, whereas sequencing involves finding the exact nucleotide sequence (in terms of A, T, G, and C) of a certain length of DNA. A whole genome, parts of the genome, or a short piece of DNA can be sequenced.
Advantages of Using SNPs Rather Than Whole-Genome Sequencing:
- Much faster analysis (hundreds or thousands of SNPs can be analysed simultaneously)
- Lower cost compared to sequencing entire genomes
- Focused on known variation sites
- Adequate for many research questions about genetic variation
Remember!
Key Points to Remember:
-
Population genetics studies how gene pools change over time, combining Mendelian genetics with Darwinian evolution to explain microevolution and macroevolution
-
Allele frequency is calculated by dividing the number of copies of an allele by the total number of copies of all alleles of that gene in the population
-
Three types of frequencies are used in population genetics: phenotypic (observable traits), genotypic (genetic combinations), and allele (individual alleles)
-
SNPs are single nucleotide changes in DNA that occur in at least 1% of a population and serve as valuable genetic markers
-
Genome-wide association studies (GWAS) use SNP data to identify genetic variations associated with diseases and other traits, focusing on haplotypes (groups of adjacent SNPs inherited together)