Inheritance Patterns in a Population (HSC SSCE Biology): Revision Notes
Population Genetics: Large-Scale Data
Introduction to large-scale data analysis
The automation of DNA technologies has revolutionised population genetics research. Scientists can now produce vast amounts of genetic data that is stored and analysed using computer software programs - a field called bioinformatics. This technological advancement has created numerous opportunities for scientific collaboration and enabled exciting new research that will significantly impact how biological science is conducted.
Large-scale data sets that are analysed computationally allow researchers to study genetic patterns across entire species ranges, over multiple generations, and involving hundreds or thousands of individuals. This approach provides insights that would be impossible to obtain from small, localised studies.
The shift from manual DNA analysis to automated, computational methods represents a fundamental transformation in biological research. What once required years of laboratory work can now be accomplished in weeks, enabling scientists to answer questions about evolution, conservation, and biodiversity on an unprecedented scale.
What is population genetics?
Population genetics is the study of genetic variation within a population, including changes in the frequency of genes and alleles within and among populations over time.
The gene pool
The gene pool refers to all the alleles of all the genes present in a particular population. Population geneticists investigate:
- Variations in alleles within the gene pool
- How these variations change from one generation to the next
- Patterns of genetic diversity across populations
Factors affecting genetic variation
Several key factors influence variation within gene pools:
- Population size: Smaller populations are more vulnerable to genetic changes
- Mutation: Creates new alleles and increases genetic diversity
- Natural selection: Favours alleles that provide survival advantages
- Genetic drift: Random changes in allele frequencies, particularly in small populations
- Environmental diversity: Different environments may favour different traits
- Migration patterns: Movement of individuals between populations introduces new alleles
A helpful memory aid for remembering these factors: Size, Selection, Mutation, Migration (SSMM). These four key forces shape the genetic composition of populations over time.
Evolutionary relationships
Genetic differences between species reveal evolutionary history. Populations with the most similar gene pools are most closely related evolutionarily. This principle underlies much of modern conservation biology and species management.
Population genetics and conservation management
Conservation genetics is a specialised subfield of population genetics that combines principles of applied ecology with evolutionary biology. Its primary aim is to prevent species extinction by maintaining biodiversity through informed conservation methods.
Traditional versus genetic approaches
Traditional conservation biology methods include:
- Field observation of species behaviour and distribution
- Population sampling and counting
- Statistical analysis of abundance and distribution patterns
Conservation genetics adds a powerful new dimension by:
- Gathering genetic data to assess biodiversity
- Making informed decisions about protecting endangered populations
- Determining conservation strategies based on genetic evidence
DNA analysis tools
Modern conservation genetics employs various sophisticated genetic tools:
- SNPs (Single Nucleotide Polymorphisms): Variations at single points in DNA sequences
- GWAS (Genome-Wide Association Studies): Analysis of genetic variation across entire genomes
- Haplotypes: Groups of genes inherited together
- Next-generation sequencing: High-throughput methods for rapid DNA analysis
These tools enable scientists to:
- Determine kinship lineages within populations
- Understand microevolution processes including selection and mutation
- Identify genome segments essential for environmental adaptation
- Determine relationships between individuals and populations
- Detect deleterious (harmful) alleles affecting health and survival
- Identify beneficial mutations that enhance survival functions
Case study: Woolly mammoth extinction
One important goal of studying population genetics is to use past extinction events to make accurate predictions about potential future extinctions. By understanding what went wrong in the past, conservation geneticists can develop better strategies to protect endangered species today.
The Wrangel Island study
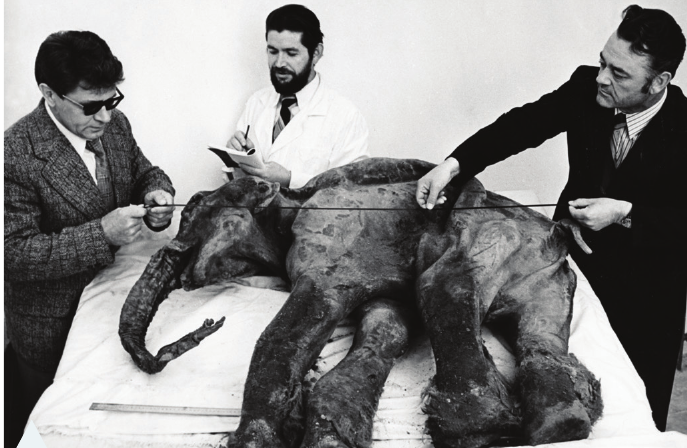
In 2015, scientists conducted a comprehensive DNA sequence comparison of two woolly mammoth specimens to investigate whether isolation led to reduced genetic diversity through inbreeding:
Sample 1: A 45,000-year-old mammoth from the Siberian mainland
Sample 2: A 4,300-year-old mammoth from Wrangel Island in the Arctic Ocean
Wrangel Island is a remote location in the Arctic Ocean where a small population of mammoths survived approximately 1,500 years longer than their mainland relatives.
Key findings
The genetic sequencing revealed that the island mammoths had accumulated a series of major detrimental mutations:
Olfactory system mutations: These affected the mammoths' sense of smell, greatly reducing their ability to:
- Mark and recognise territory
- Hunt for food
- Find mates
Urinary protein mutations: Reduced the number and variety of proteins in urine, further compromising territorial marking and mating behaviour
FOXQ1 gene mutations: Two mutations in this gene affected hair structure, giving Wrangel Island mammoths:
- Translucent, cream-coloured fur
- Satiny coat texture
- Reduced insulation properties
The reduced insulation was particularly problematic in ice age climates where maintaining body heat is essential for survival. This demonstrates how seemingly minor genetic changes can have catastrophic consequences when populations become isolated.
Genomic meltdown
The Wrangel Island mammoth population suffered what scientists call a genomic meltdown - a catastrophic loss of genetic fitness due to:
- Geographic isolation preventing gene flow from other populations
- Inbreeding within the small island population
- Loss of genetic diversity
- Accumulation of harmful mutations
- Increased susceptibility to disease
- Reduced ability to survive in their environment
Critical Finding: The population crashed from tens of thousands to around 1,000 individuals before ultimately going extinct. This demonstrates the devastating effects of isolation and inbreeding on small populations.
Conservation implications
This study demonstrates how population genetics and conservation genetics can inform modern conservation efforts. The mammoth data shows that:
- Isolated populations face increased extinction risk
- Genetic diversity is essential for long-term survival
- Small population sizes lead to inbreeding and fitness loss
- Conservation strategies must maintain genetic diversity and connectivity between populations
Case study: Modern koala populations
The koala (Phascolarctos cinereus) provides an excellent example of how large-scale genetic data can inform conservation management of living species.
Koala biology and distribution
Koalas are tree-dwelling, medium-sized marsupials with distinctive features:
- Sturdy body build
- Large rounded ears
- Grey-coloured fur
- Sharp claws for climbing
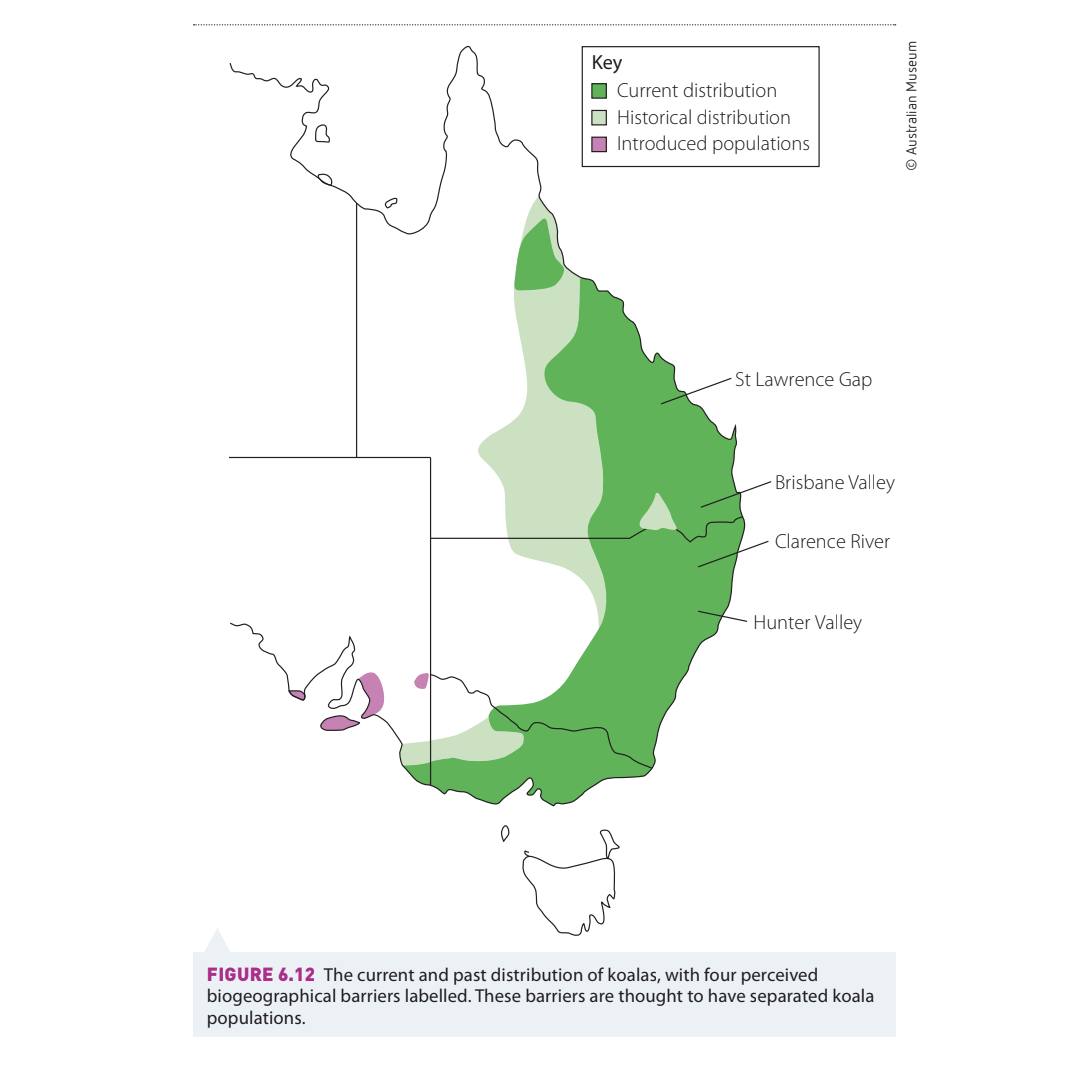
Geographic range: Eastern Australia, from northern Queensland to South Australia
Size variation: A clear gradient exists where southern koalas are larger and heavier than northern Queensland koalas. Males are larger than females throughout the range.
Historical distribution and barriers
During the last ice age (approximately 20,000 years ago), two major biogeographic barriers separated koala populations:
- Brisbane River Valley
- Clarence River Valley
These natural barriers impeded movement between populations, reducing gene flow. When the ice age ended, these barriers disappeared, but modern habitat fragmentation has once again restricted gene flow between koala populations.
Species classification
Despite phenotypic (physical appearance) differences between geographically distant groups, recent large-scale genetic studies have confirmed that all koalas belong to a single species. Historical debates about subspecies status have been resolved through genetic evidence.
Threats to koala populations
Current threats include:
- Historical fur trade: Late 19th and early 20th centuries caused significant population declines
- Habitat clearance: Ongoing loss of eucalyptus forests
- Predation: By introduced predators
- Vehicle strikes: Road mortality in fragmented habitats
- Disease: Chlamydia infections affecting fertility
- Bushfires: Catastrophic fire events
- Drought: Climate-related stress
Population status
Northern populations (Queensland): Numbers are declining due to habitat destruction and fragmentation
Southern populations: Generally healthier with stable numbers
The large-scale genetic study
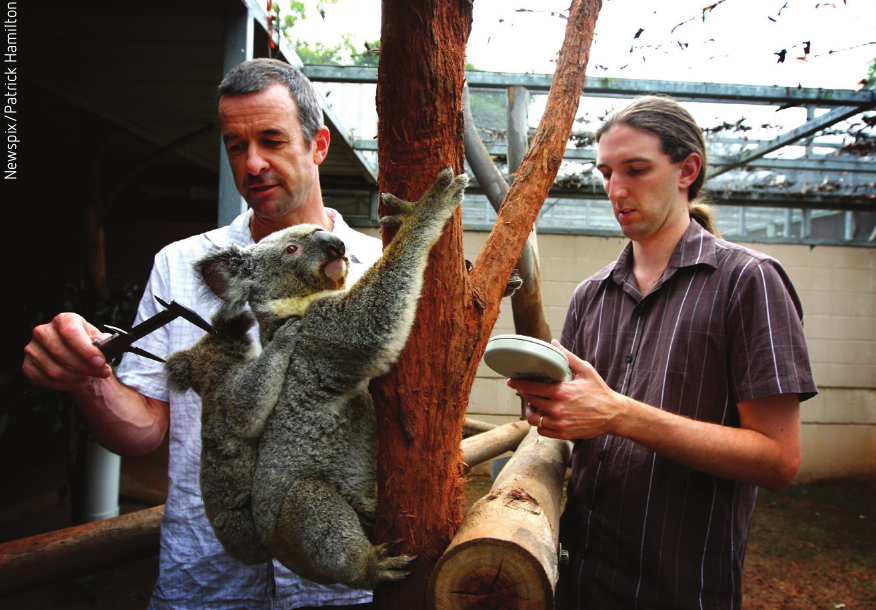
Most previous koala genetic studies focused on local populations. However, a recent major study gathered the largest amount of genetic data ever collected for koalas, with several important features:
Geographic scope: All koala habitats across the entire species range
Sample size: 662 wild koalas
Temporal range: Data spanning from the 1870s to 2015
Collaborative effort: Researchers, consultants, hospitals, and museums working together
Sample type: Ear punch tissue samples for DNA analysis
This comprehensive approach generated large-scale data sets suitable for computational analysis, providing insights into genetic variation across the entire species. This represents a paradigm shift from traditional small-scale, localized studies to comprehensive, species-wide genetic assessment.
Understanding haplotype networks
To interpret population genetics data, we need to understand haplotypes and how they are visualised.
What are haplotypes?
A haplotype is a group of genetic markers (SNPs or genes) that are inherited together on a particular chromosome from one parent. In the koala study, researchers examined mitochondrial DNA (mtDNA), which is inherited only from the mother.
Key points about haplotypes:
- Organisms with the same haplotype have identical genetic information at the tested chromosome region
- Shared haplotypes indicate close genetic relationships
- Comparing haplotypes between populations reveals which populations are most closely related
- Haplotypes help determine recent evolutionary history
What is a haplotype network?
A haplotype network is a two-dimensional diagram that summarises genetic diversity within a group. It can be interpreted alongside geographic maps to understand both evolutionary and geographical history.
How to interpret haplotype networks
Worked Example: Reading a Haplotype Network
When examining a haplotype network, remember these key features:
Step 1: Identify the circles Each circle represents a unique haplotype (genetic variant).
Step 2: Interpret circle size The size is proportional to the number of individuals sampled with that haplotype:
- Larger circles = more individuals share that particular genetic variant
- Smaller circles = fewer individuals with that variant
Step 3: Examine the connections Lines connect each haplotype to its most similar genetic relative.
Step 4: Count the mutations Bars on lines represent mutational steps between haplotypes:
- More bars = greater genetic difference
- No bars = very closely related with minimal mutations
Simple example
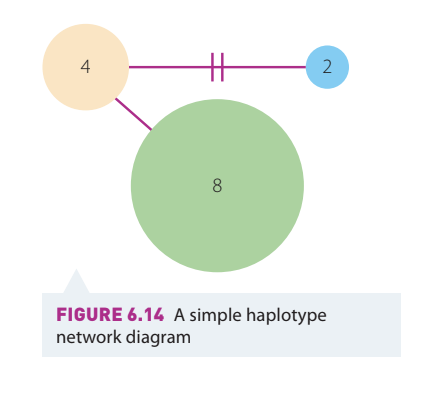
This simplified haplotype network shows three different haplotypes:
- Haplotype with 8 individuals (largest circle): The most common genetic variant
- Haplotype with 4 individuals (medium circle): Intermediate frequency
- Haplotype with 2 individuals (smallest circle): Least common variant
The circles with 8 and 4 individuals are most closely related (connected by a line with no bars). The two bars on the line between the haplotypes with 2 and 4 individuals indicate two mutational steps, showing genetic divergence between these groups.
Koala genetic diversity: The data
Sampling locations and methodology
Researchers analysed the mitochondrial DNA control region (mtDNA CR) from 662 koala tissue samples. This non-coding section of mtDNA was sequenced using next-generation methods to identify different haplotypes.
The study also incorporated existing published koala haplotypes from the GenBank database, maximising the available data for analysis.
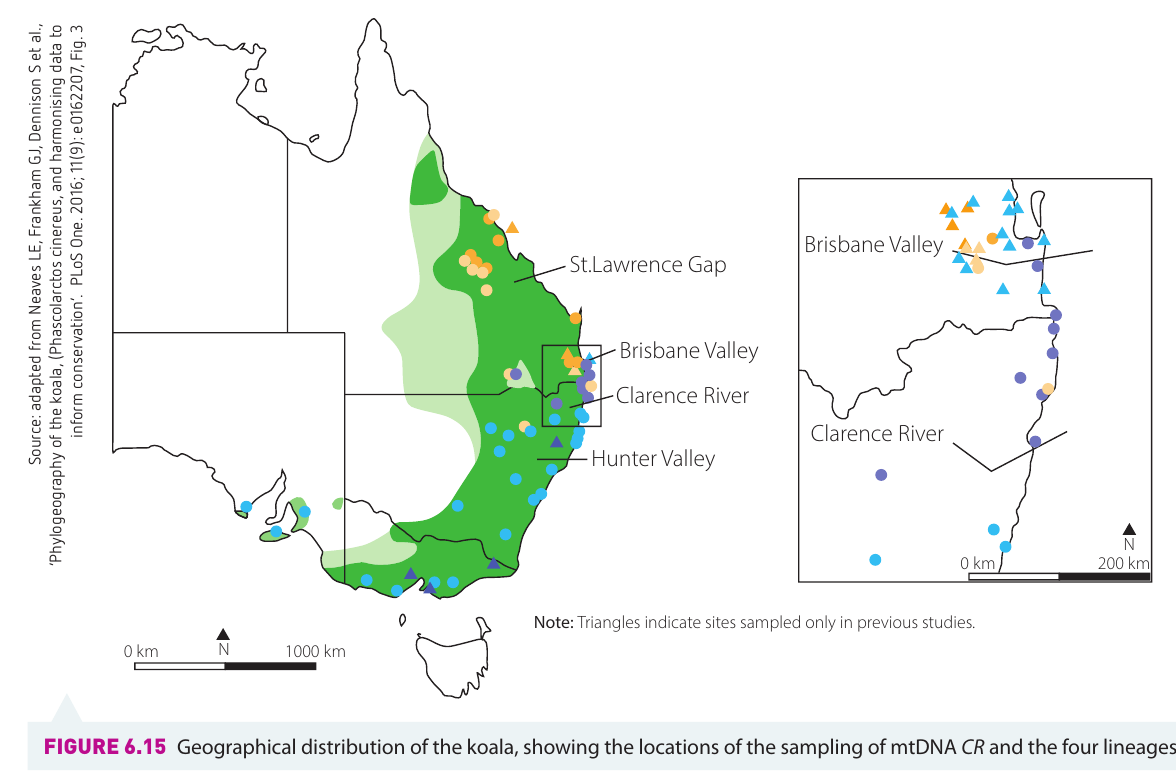
Four genetic lineages identified
Analysis of the mtDNA CR revealed 53 unique haplotypes distributed across four distinct lineages:
- Northern group 1 lineage (orange in diagrams)
- Northern group 2 lineage (pink in diagrams)
- Central lineage (purple in diagrams)
- Southern lineage (blue in diagrams)
Koala haplotype network
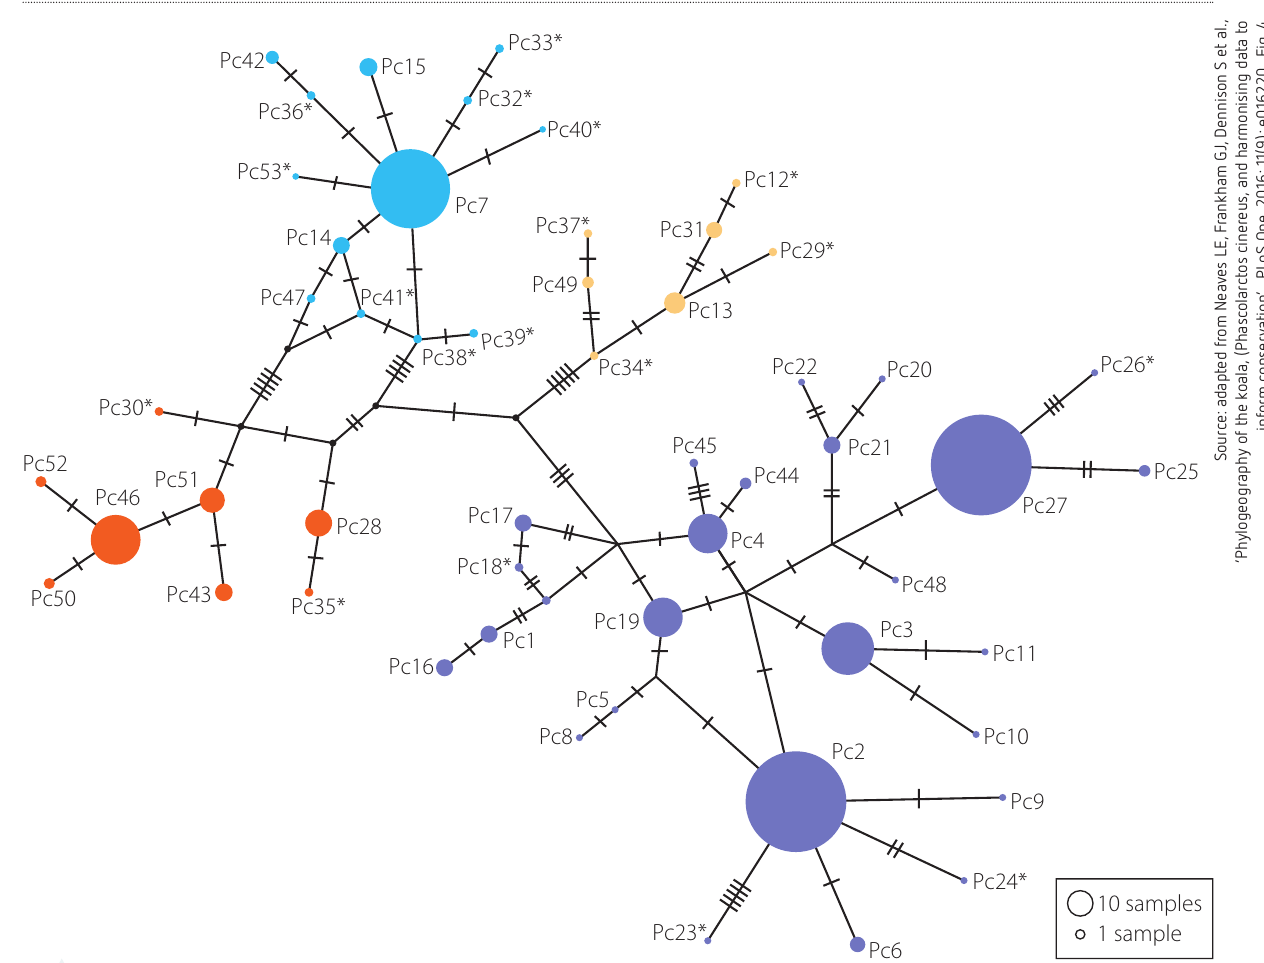
This complex haplotype network shows all 53 koala haplotypes identified in the study. Each haplotype is labelled with "Pc" (for Phascolarctos cinereus) followed by a number. The four coloured groups represent the four lineages:
Orange circles: Northern group 1 lineage Pink circles: Northern group 2 lineage Purple circles: Central lineage Blue/cyan circles: Southern lineage
Key Patterns in the Network:
- The central lineage (purple) shows the greatest number of distinct haplotypes, indicating high genetic diversity
- The southern lineage (blue) has fewer haplotypes but includes some very common variants (large circles)
- Multiple mutational steps separate some lineages, indicating genetic divergence over time
- Some haplotypes marked with asterisks (*) were recorded from GenBank but not detected in this study
Haplotype diversity across locations
The following table shows genetic diversity data for 20 sampling locations across the koala range:
| Location key | Location | Sample size | Haplotypes (n) | Haplotype diversity |
|---|---|---|---|---|
| 1 | Whitsunday, Qld | 8 | 4 | 0.75 |
| 2 | Blair Athol, Qld | 10 | 2 | 0.20 |
| 3 | Clermont, Qld | 38 | 5 | 0.37 |
| 4 | Maryborough, Qld | 11 | 1 | — |
| 5 | Redlands, Qld | 7 | 2 | 0.46 |
| 6 | Coomera, Qld | 21 | 1 | — |
| 7 | Tyagarah, NSW | 17 | 1 | — |
| 8 | Ballina, NSW | 37 | 2 | 0.074 |
| 9 | Iluka, NSW | 7 | 1 | — |
| 10 | Pine Creek, NSW | 50 | 1 | — |
| 11 | Port Macquarie, NSW | 142 | 3 | 0.45 |
| 12 | Maitland, NSW | 7 | 1 | — |
| 13 | Campbelltown, NSW | 24 | 4 | 0.663 |
| 14 | East Gippsland, Vic | 19 | 3 | 0.119 |
| 15 | French Island, Vic | 33 | 1 | — |
| 16 | Cape Otway, Vic | 19 | 1 | — |
| 17 | Bessiebelle, Vic | 14 | 2 | — |
| 18 | Mt Lofty Ranges, SA | 33 | 6 | 0.662 |
| 19 | Eyre Peninsula, SA | 19 | 1 | 0.61 |
| 20 | Kangaroo Island, SA | 26 | 3 | 0.227 |
| Overall | All locations | 662 | 36 | 0.84 |
Understanding haplotype diversity values:
- Values range from 0 to 1
- Higher values indicate greater genetic diversity
- A dash (—) indicates that diversity could not be calculated (only one haplotype present)
- The overall diversity of 0.84 indicates relatively high genetic diversity across all koala populations combined
Key observations:
- Location 1 (Whitsunday) shows the highest diversity (0.75) for Queensland locations
- Locations 18 (Mt Lofty Ranges) and 13 (Campbelltown) show high diversity (0.662 and 0.663)
- Many locations show very low diversity or only a single haplotype
- Locations with single haplotypes may be at higher conservation risk (6, 7, 9, 10, 12, 15, 16)
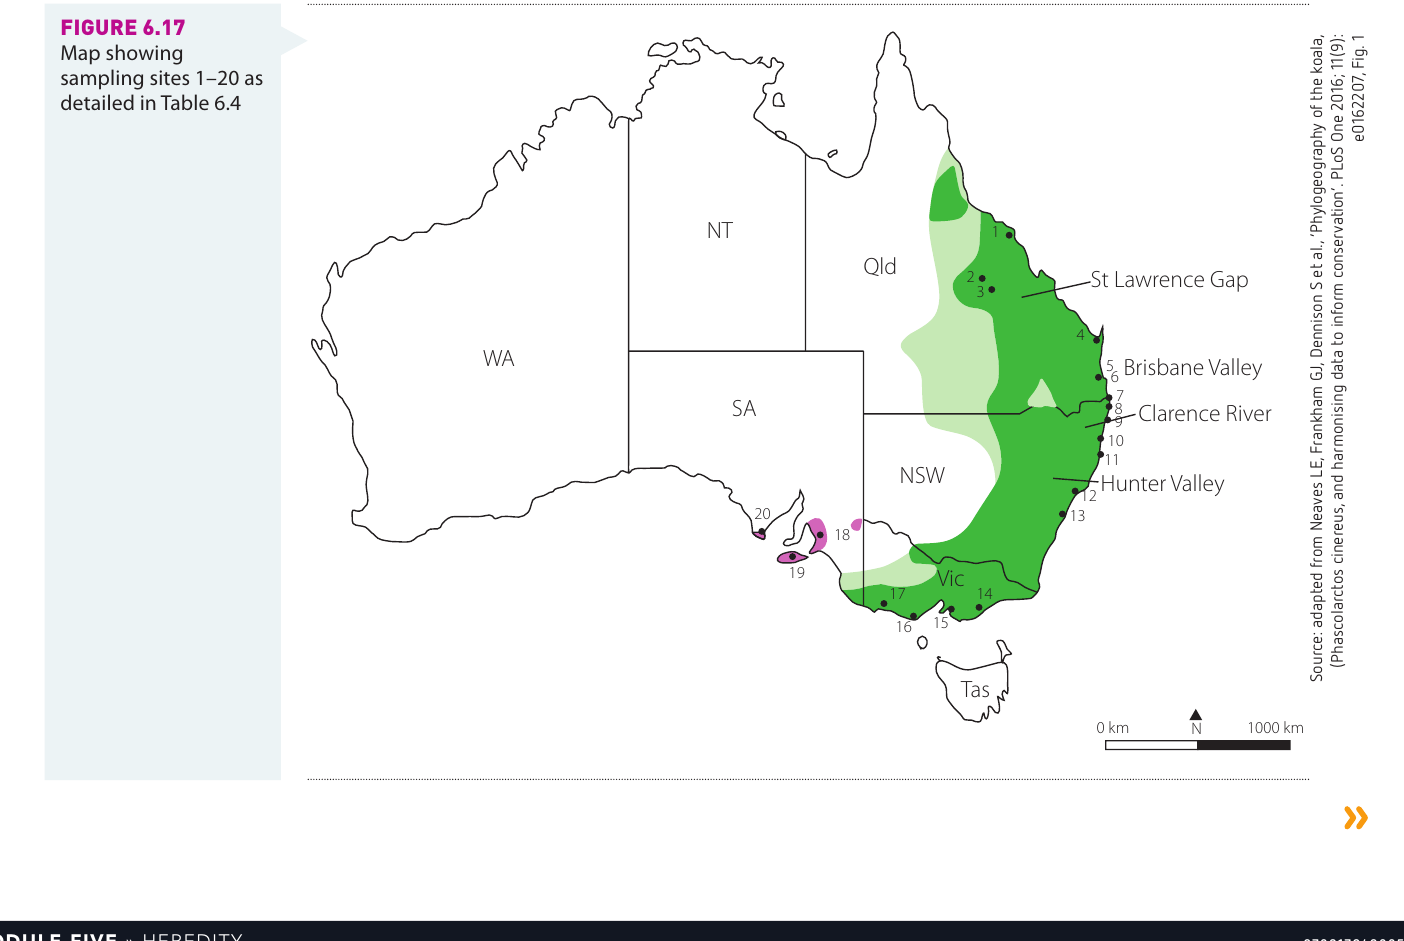
This map shows all 20 sampling locations across eastern Australia. Notice how the locations span the entire koala range from northern Queensland to South Australia, with particular concentration in coastal regions.
Geographic distribution of lineages
The haplotype network and geographic data reveal distinct regional patterns:
Northern region (far north NSW and Queensland):
- Contains northern group 1 lineage (orange)
- Contains northern group 2 lineage (pink)
- Contains central lineage (purple)
- High genetic diversity with multiple lineages present
Southern region (majority of NSW, Victoria, and South Australia):
- Predominantly southern lineage (blue)
- Lower genetic diversity
- Fewer haplotypes present in most locations
Central lineage distribution:
- Primarily located in the mid-to-north Queensland region
- Shows the greatest number of unique haplotypes
- Represents an evolutionarily distinct group
Pairwise genetic comparisons
The following table compares DNA sequences between different koala populations. Numbers range from 0 (no significant genetic difference) to 1 (most genetically different). This is a simplified excerpt showing key comparisons:
| Location | 1 | 2 | 3 | 4 | 5 | 6 | 7 | 8 | 9 | 10 |
|---|---|---|---|---|---|---|---|---|---|---|
| 1 | — | |||||||||
| 2 | 0.09 | — | ||||||||
| 3 | 0.21 | 0 | — | |||||||
| 4 | 0.57 | 0.78 | 0.75 | — | ||||||
| 5 | 0.72 | 0.84 | 0.87 | 0.94 | — | |||||
| 6 | 0.87 | 0.94 | 0.91 | 1.0 | 0.66 | — | ||||
| 7 | 0.84 | 0.93 | 0.90 | 1.0 | 0.62 | 0 | — | |||
| 8 | 0.81 | 0.89 | 0.88 | 0.93 | 0.39 | 0 | 0 | — | ||
| 9 | 0.75 | 0.88 | 0.88 | 1.0 | 0.44 | 0 | 0 | 0 | — | |
| 10 | 0.92 | 0.96 | 0.94 | 1.0 | 0.98 | 1.0 | 1.0 | 0.97 | 1.0 | — |
Worked Example: Interpreting Pairwise Comparisons
Step 1: Understand the scale
- 0 (zero) = Populations show no significant genetic difference
- Values close to 0 = Populations are closely related genetically
- Values close to 1 = Populations are genetically divergent
- 1.0 = Maximum genetic difference
Step 2: Identify patterns Looking at locations 6, 7, 8, and 9 (all showing 0 when compared to each other):
- These geographically close populations share genetic similarities
- They likely represent a single genetic group
- Gene flow may have occurred between these populations historically
Step 3: Spot genetic isolation Location 10 (Pine Creek) shows very high values (0.92-1.0) when compared to most other locations:
- This indicates genetic isolation
- The population has diverged significantly from others
- It represents a unique genetic lineage
Key patterns:
Northern region (locations 1-9):
- Locations 2 and 3 show no genetic difference (0)
- Locations 6, 7, 8, and 9 all show zero genetic difference from each other
- These geographically close populations share genetic similarities
Geographic isolation effects:
- Location 10 (Pine Creek) shows very high values (0.92-1.0) when compared to most other locations
- Location 4 (Maryborough) shows high divergence from many locations (0.75-1.0)
- These patterns suggest genetic isolation
Conservation implications:
- Populations showing high divergence (values near 1.0) represent evolutionarily distinct groups
- Maintaining diversity requires protecting all lineages
- Introduced populations (locations 19 and 20) can be matched to their source populations using this data
Conservation implications and management strategies
Key findings from the koala study
This large-scale genetic analysis has revealed several critical insights:
1. Four distinct lineages exist: The identification of four genetic lineages (two northern groups, one central, and one southern) demonstrates that koala populations are not genetically uniform. Each lineage represents a unique evolutionary history.
2. Regional differences in diversity:
- Northern populations show higher genetic diversity with multiple lineages present
- Southern populations show lower diversity, predominantly containing a single lineage
- Central populations show unique genetic variants not found elsewhere
3. Geographic barriers matter: The historical biogeographic barriers (Brisbane Valley and Clarence River) have influenced genetic structure. Even though these barriers are no longer physical obstacles, their historical effect on population separation is still visible in the genetic data.
4. Management must be region-specific: Because genetic diversity varies significantly across the koala range, conservation strategies should not be uniform. Local management needs to consider the genetic characteristics of each population.
5. Southern populations require attention: Many southern locations show only a single haplotype, indicating very low genetic diversity. These populations may be more vulnerable to:
- Disease outbreaks
- Environmental changes
- Inbreeding effects
- Reduced adaptive potential
6. Importance of overall distribution: The study demonstrates that effective koala management must consider the entire species distribution, not just local populations. Decisions about population control or translocation should account for genetic distinctiveness.
Applying lessons from the mammoth study
The woolly mammoth case study provides a cautionary tale relevant to modern koala conservation:
Isolation leads to problems: Just as Wrangel Island mammoths suffered from isolation, koala populations in habitat fragments face similar risks.
Genetic diversity is protective: Populations with higher genetic diversity have greater resilience to environmental challenges and disease.
Small population size is risky: When populations become too small, inbreeding becomes inevitable, leading to accumulation of harmful mutations.
Prevention is key: Once genetic diversity is lost, it cannot be easily restored. Conservation efforts must maintain connectivity between populations before diversity is lost.
Management recommendations
Based on the genetic data:
For southern populations with low diversity:
- Consider carefully planned genetic rescue through managed translocation
- Identify source populations that are genetically compatible
- Maintain habitat corridors to enable natural gene flow
- Monitor health and fertility indicators closely
For northern populations with high diversity:
- Prioritise habitat protection to maintain diverse lineages
- Prevent further fragmentation that could isolate subpopulations
- Recognise these populations as genetic reservoirs for the species
For all populations:
- Use genetic data to inform translocation decisions
- Avoid mixing genetically distinct lineages inappropriately
- Maintain detailed genetic databases for future reference
- Continue monitoring genetic diversity over time
Remember!
Key Points to Remember:
-
Large-scale genetic data analysed through bioinformatics enables comprehensive population genetics studies that were previously impossible.
-
Population genetics studies the gene pool - all alleles of all genes in a population - and how allele frequencies change over generations due to factors like population size, mutation, natural selection, genetic drift, and migration.
-
Conservation genetics uses genetic data to inform conservation decisions, identifying which populations are most at risk, detecting harmful alleles, and determining genetic relationships between individuals and populations.
-
Haplotype networks visualise genetic diversity: larger circles represent more individuals sharing a haplotype, and bars on connecting lines indicate mutational steps (genetic divergence) between groups.
-
Case studies demonstrate real applications: The woolly mammoth study showed how isolation leads to inbreeding and genomic meltdown, while the koala study reveals that different populations have different levels of genetic diversity requiring region-specific conservation strategies.