Patterns of Non-Infectious Disease (HSC SSCE Biology): Revision Notes
Patterns of Non-Infectious Disease
Introduction to epidemiology
When scientists observe that a particular disease appears to be increasing in a population, they need to answer important questions: Are there patterns to this disease? What causes it? How can we prevent it? To answer these questions, researchers conduct epidemiological studies.
What is epidemiology?
The term 'epidemiology' comes from two Greek words: epi (meaning 'upon') and demos (meaning 'people' or 'populace'). Literally, it means the study of 'that which is upon people'. While doctors focus on disease in individual patients, epidemiologists study disease across entire populations.
The key difference between clinical medicine and epidemiology is the scale of study: doctors treat individual patients, while epidemiologists examine patterns across entire populations to understand and prevent disease.
The World Health Organisation (WHO) defines epidemiology as:
The study of the distribution and determinants of health-related states or events (including disease), and the application of this study to the control of diseases and other health problems.
What do epidemiologists study?
Epidemiologists can investigate both infectious and non-infectious diseases, as well as other health events such as:
- Suicides
- Car accidents
- Work-related injuries
- Chronic diseases like cancer and diabetes
Key purposes of epidemiological studies
Epidemiological research helps public health authorities to:
- Identify causes - Determine what factors contribute to disease development
- Target populations - Identify which groups are most affected
- Develop interventions - Create strategies to prevent disease occurrence
- Allocate resources - Direct limited public health funding to where it's needed most
- Evaluate strategies - Assess whether current control measures are working effectively
Epidemiological studies serve as the foundation for public health policy decisions. Without understanding disease patterns and causes, health authorities cannot effectively allocate resources or develop targeted prevention strategies.
Analysing patterns of non-infectious disease
The role of epidemiological studies
Epidemiological studies play a crucial role in identifying patterns in disease through analysis of:
- Incidence - The number of new cases diagnosed in a specific time period
- Distribution - How disease is spread across different populations and locations
- Prevalence - The total number of people living with the disease at a given time
- Mortality rates - The number of deaths from the disease
These studies also investigate which population groups face higher risks and determine the most effective strategies for disease control.
Understanding the difference between incidence and prevalence:
- Incidence tells us how quickly new cases are occurring (rate of new diagnoses)
- Prevalence tells us the total burden of disease in the population (all existing cases)
- A disease can have high prevalence but low incidence if people live with it for many years
Methods of data analysis
Researchers use accepted scientific and mathematical models to statistically analyse collected data. This analysis provides information about:
- Trends for the overall population
- Patterns in specific population subsets (males vs females, different age groups, different ethnic backgrounds, different geographic locations)
Presenting epidemiological data
Data is typically presented in multiple formats to help identify trends and patterns:
- Tables - Allow precise comparison of numerical values
- Graphs - Reveal visual trends over time or between groups
- Age-specific rates - Show how disease affects different age groups
- Age-standardised rates - Allow fair comparison between populations with different age structures
Case study: Colorectal cancer patterns in Australia
Understanding colorectal cancer
Colorectal cancer (also called bowel cancer) includes all cancers affecting the colon and rectum. Understanding its epidemiological patterns helps identify risk factors and improve prevention strategies.
Risk factors
Hereditary factors:
- 25% of cases have some hereditary influence
- 75% of cases have no family history
While family history is a significant risk factor for some patients, the majority of colorectal cancer cases (75%) occur in people with no family history. This means lifestyle and environmental factors play a crucial role in disease development.
Age:
- Sharp increase in incidence after age 50
Lifestyle and environmental factors:
- Smoking and alcohol consumption
- Eating red meat, especially when charred
- Consuming processed meats (preserved, salted, cured, or smoked)
- Being overweight or obese
- Lack of physical activity
Age-specific incidence and mortality patterns
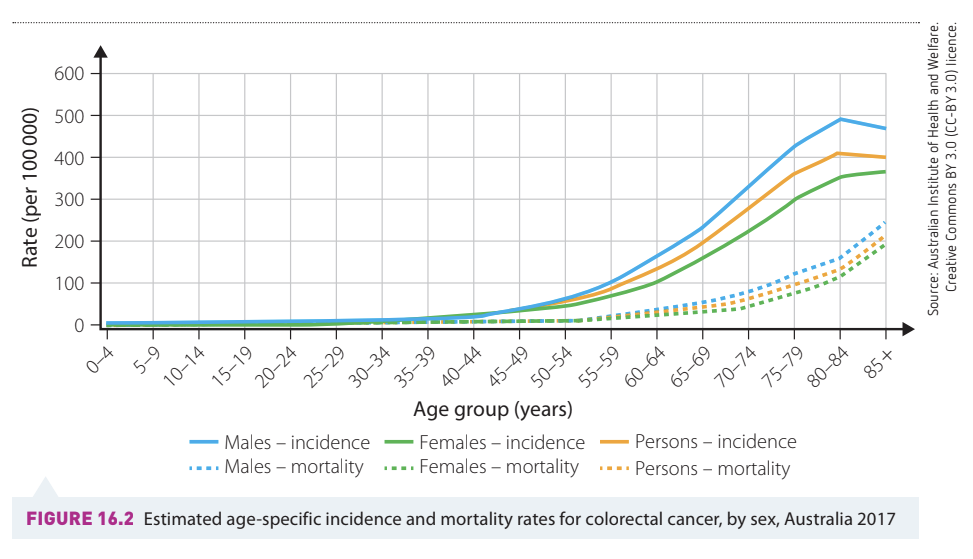
Analysis of age-specific data for Australia in 2017 reveals several important patterns:
Age patterns:
- Incidence and mortality rates are very low in young age groups
- Both measures increase dramatically with age
- The highest rates occur in people aged 85 and above
- The sharp rise begins around age 50, confirming age as a major risk factor
Gender differences:
- Males consistently show higher incidence rates than females across all age groups
- Males also have higher mortality rates than females
- The gap between males and females widens in older age groups
Example: Interpreting Age-Specific Data
When examining the graph for 2017:
- At age 40-44, incidence rates are approximately 20-30 per 100,000 population
- At age 60-64, rates jump to approximately 150-200 per 100,000 population
- At age 85+, rates reach approximately 400-450 per 100,000 population
This demonstrates that your risk of developing colorectal cancer increases more than 15-fold between middle age and old age.
Trends over time (1968-2014)
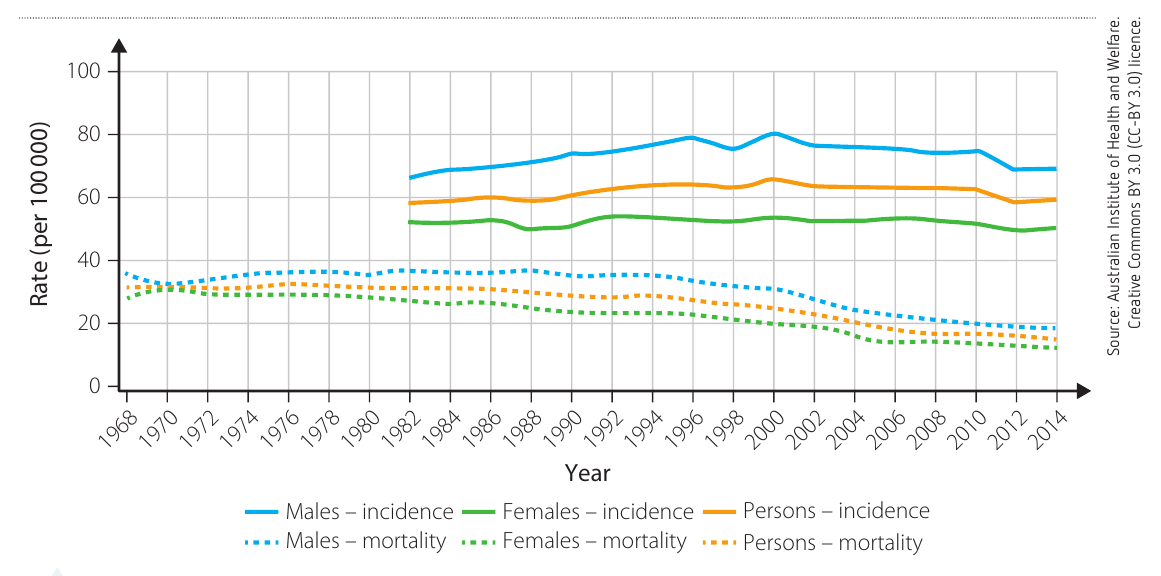
Examining long-term trends reveals important changes in colorectal cancer patterns:
Incidence trends (1982-2013):
- Incidence rates increased from the 1980s through the mid-1990s
- Rates have plateaued or slightly decreased since around 2000
- Males continue to show higher rates than females
- The gap between male and female incidence has narrowed slightly in recent years
Mortality trends (1968-2014):
- Mortality rates have shown a consistent downward trend over the entire period
- Death rates have approximately halved since the late 1960s
- This decline is observed for both males and females
- Males still have higher mortality than females, but the difference is decreasing
A Critical Observation: Declining Mortality with Stable Incidence
This pattern tells us something very important: more people are being diagnosed with colorectal cancer (or rates are stable), but fewer people are dying from it. This is a hallmark of improved healthcare - better detection and treatment are saving lives even though we haven't eliminated the disease.
Reasons for declining mortality despite stable incidence:
- Earlier detection through screening programmes
- Improved surgical techniques
- More effective treatment options
- Better post-operative care
- Increased public awareness leading to earlier presentation
Survival rates
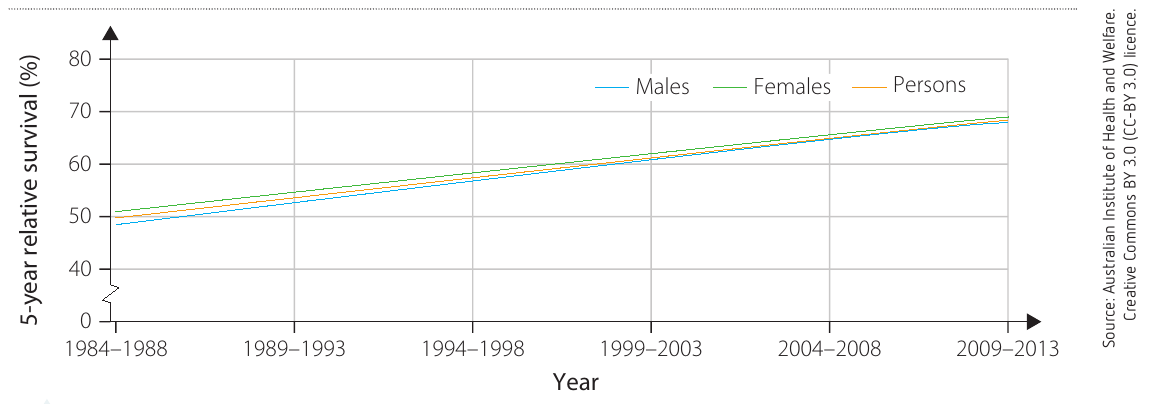
The 5-year relative survival rate indicates the percentage chance that someone diagnosed with colorectal cancer will still be alive five years later.
Key trends (1984-2013):
- Survival rates have improved dramatically over three decades
- In 1984-1988, approximately 48-50% of patients survived 5 years
- By 2009-2013, this had increased to approximately 68-70%
- Males and females show very similar survival rates
- The improvement has been steady and consistent
The 5-year survival rate is a standard measure in cancer epidemiology. It doesn't mean patients only live 5 years - rather, it measures what proportion of patients are still alive 5 years after diagnosis, which helps compare treatment effectiveness over time.
Factors contributing to improved survival:
- Better treatment protocols
- More effective chemotherapy drugs
- Advances in surgical techniques
- Earlier stage diagnosis through screening
- Improved supportive care
Global patterns of colorectal cancer
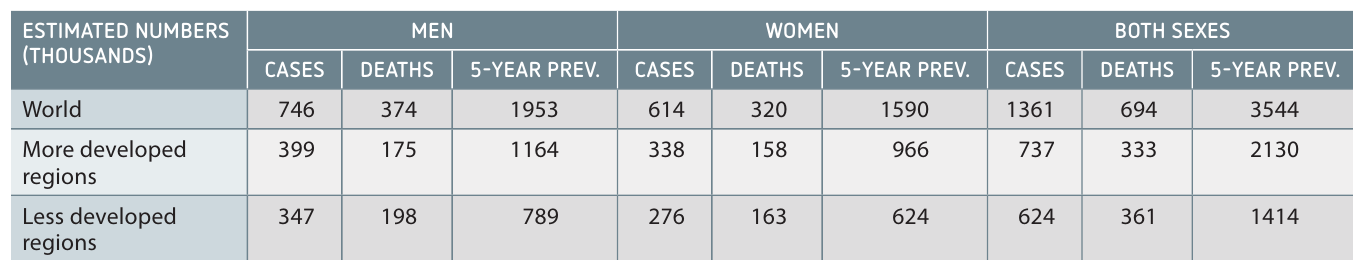
Worldwide data from 2012 shows significant variation in colorectal cancer burden:
Global overview:
- 1.36 million new cases worldwide
- 694,000 deaths
- 3.54 million people living with the disease (5-year prevalence)
Regional disparities:
- More developed regions show much higher incidence rates
- Less developed regions have lower incidence but higher mortality relative to incidence
- This suggests differences in both risk factors and access to treatment
The pattern of high incidence but lower mortality in developed nations versus lower incidence but higher mortality in less developed regions reveals a critical inequality: wealthier countries have better access to screening and treatment, which saves lives even when disease rates are higher.
Gender patterns globally:
- Males have higher incidence than females worldwide (746,000 vs 614,000 cases)
- Males also have higher mortality (374,000 vs 320,000 deaths)
- This pattern is consistent across most world regions
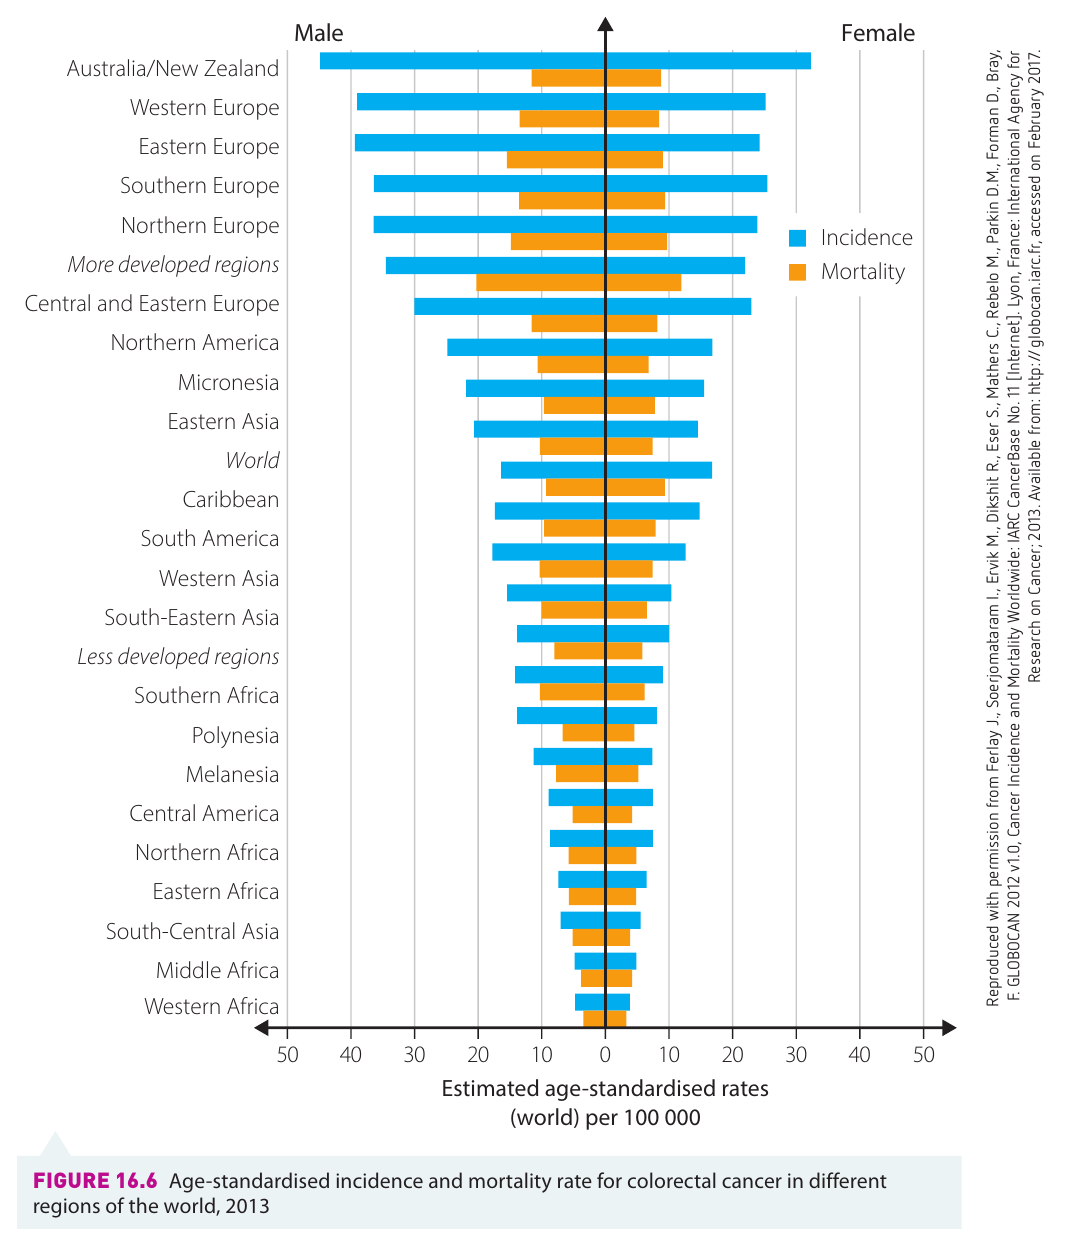
Geographic analysis reveals:
Highest incidence regions:
- Australia/New Zealand
- Western Europe
- Northern Europe
- Northern America
Lowest incidence regions:
- Western Africa
- Middle Africa
- South-Central Asia
These patterns correlate strongly with:
- Economic development
- Dietary patterns (high meat consumption in developed nations)
- Lifestyle factors (physical inactivity, obesity)
- Age structure of populations
The geographic distribution of colorectal cancer provides strong evidence for the role of environmental and lifestyle factors. The disease is much more common in wealthy, industrialized nations with Western dietary patterns, suggesting that diet and lifestyle choices significantly influence disease risk.
Indigenous vs non-Indigenous Australians
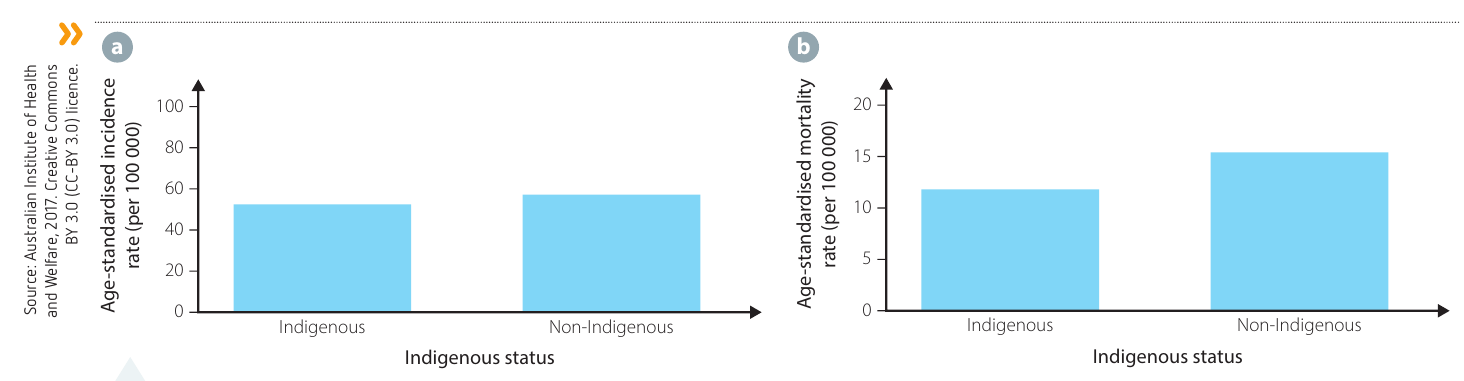
Comparing colorectal cancer patterns between Indigenous and non-Indigenous Australians reveals important health disparities:
Incidence rates (2008-2012):
- Indigenous and non-Indigenous Australians show similar age-standardised incidence rates
- Both groups experience approximately 50-55 cases per 100,000 population
Mortality rates (2010-2014):
- Indigenous Australians have a lower age-standardised mortality rate
- Non-Indigenous: approximately 15.5 deaths per 100,000
- Indigenous: approximately 12 deaths per 100,000
Possible explanations for mortality difference:
- Younger age structure of Indigenous population
- Different distribution of cancer stages at diagnosis
- Access to treatment services
- Other competing causes of mortality in Indigenous populations
Interpreting age-standardised rates:
The lower mortality rate in Indigenous Australians may seem surprising given known health disparities. However, age-standardisation can mask important differences. The younger age structure of the Indigenous population (with fewer people in the high-risk elderly age groups) may contribute to this pattern. Further investigation of age-specific rates and access to care is needed for a complete understanding.
Key epidemiological concepts
Understanding rates
Incidence rate:
- Measures new cases diagnosed during a specific time period
- Usually expressed per 100,000 population
- Helps identify if a disease is becoming more or less common
Prevalence:
- Total number of people living with the disease at a specific time
- Can be measured over different time periods (e.g., 1-year prevalence, 5-year prevalence)
- Affected by both incidence and survival rates
Mortality rate:
- Number of deaths from the disease in a specific time period
- Usually expressed per 100,000 population
- Indicates the lethality of the disease
Example: Understanding the Relationship Between Measures
Consider a disease with:
- High incidence (many new cases each year)
- High survival rate (most people live for many years after diagnosis)
- Result: Very high prevalence (many people living with the disease)
Versus a disease with:
- Low incidence (few new cases each year)
- Low survival rate (most people die quickly after diagnosis)
- Result: Low prevalence (few people living with the disease at any time)
This shows why prevalence depends on both how many people get the disease and how long they survive with it.
Age-specific vs age-standardised rates
Age-specific rates:
- Show disease rates within specific age groups (e.g., 45-49 years, 50-54 years)
- Useful for identifying which age groups are most affected
- Help target screening and prevention programmes
Age-standardised rates:
- Adjust for differences in age structure between populations
- Allow fair comparison between populations with different age distributions
- Essential when comparing trends over time or between countries
Why age-standardisation matters:
Imagine comparing colorectal cancer rates between two countries:
- Country A has many elderly people (who have higher cancer risk)
- Country B has a younger population
Without age-standardisation, Country A will appear to have much higher rates simply because it has more older people. Age-standardisation removes this bias, allowing us to see whether one country truly has higher risk, or whether the difference is just due to population age structure.
Practical applications of epidemiological data
Informing public health strategies
Analysis of colorectal cancer patterns has led to:
Screening programmes:
- National Bowel Cancer Screening Programme in Australia
- Targets people over 50 (when risk sharply increases)
- Free screening kits sent to eligible age groups
Prevention campaigns:
- Public health messages about diet and lifestyle
- Emphasis on physical activity and healthy weight
- Warnings about processed meat consumption
- Anti-smoking campaigns
Resource allocation:
- Directing research funding to improve treatment
- Planning healthcare services based on projected disease burden
- Training specialists in areas with growing need
The decision to target screening at people over 50 is a direct result of epidemiological data showing that incidence rates increase sharply from this age. This demonstrates how pattern analysis directly informs evidence-based public health policy.
Predicting future trends
Based on current patterns, epidemiologists can predict:
- Which population groups will need more services
- How many treatment facilities will be required
- The likely impact of aging populations on disease burden
- The potential benefits of prevention programmes
Example: Predicting Future Healthcare Needs
Using current age-specific incidence data and population projections:
Step 1: Identify that people aged 65+ have the highest colorectal cancer rates
Step 2: Note that Australia's population is aging (more people entering 65+ age bracket)
Step 3: Calculate that even if age-specific rates stay constant, total case numbers will increase significantly
Step 4: Plan to increase treatment facilities, train more specialists, and enhance screening programmes to meet future demand
This demonstrates how epidemiological data enables proactive health system planning.
Remember!
Key Points to Remember:
-
Epidemiology studies patterns of disease in populations (not individuals) to identify causes, affected groups, and effective interventions
-
Key measures include incidence (new cases), prevalence (total cases), and mortality rates (deaths), which can be age-specific or age-standardised
-
Colorectal cancer shows clear patterns: increases dramatically with age, affects males more than females, and has higher rates in developed nations
-
Mortality is declining even though incidence remains stable, demonstrating the impact of improved screening, early detection, and better treatment
-
Epidemiological data directly informs public health policy, screening programmes, and resource allocation to improve population health outcomes