Ultraviolet-Visible Spectrophotometry (HSC SSCE Chemistry): Revision Notes
Ultraviolet-Visible Spectrophotometry
Introduction to UV-visible spectrophotometry
UV-visible spectrophotometry is a powerful analytical technique that allows scientists to measure the concentration of various substances. This method is effective for determining the concentration of:
- Inorganic molecules
- Organic molecules
- Metal ions
The technique has wide-ranging applications across multiple industries. It is particularly valuable for determining reaction rates and calculating equilibrium constants. Industries that rely heavily on UV-vis spectrophotometry include:
- Pharmaceutical industry (drug testing and quality control)
- Dye industry (colour consistency)
- Paint industry (pigment analysis)
- Ink industry (formulation quality)
This technique shares similarities with atomic absorption spectroscopy (AAS) and colourimetry, which you may have encountered in previous studies. All three methods involve measuring how much light is absorbed by a sample, but they differ in the wavelength ranges used and the types of substances they can analyze.
How UV-visible spectrophotometry works
Wavelength ranges
UV-visible spectrophotometry uses electromagnetic radiation from two regions of the spectrum:
- Ultraviolet (UV) region: 190 to 400 nm
- Visible region: 400 to 800 nm
Basic principles
The fundamental principle behind UV-vis spectrophotometry involves electron excitation. Here's how it works:
When molecules are exposed to light energy that matches the energy gap between electron energy levels, electrons absorb that energy and move to higher energy states. This absorption of light energy at specific wavelengths creates the absorption spectrum we measure.
Most organic molecules are colourless because they don't absorb light in the visible region. However, many natural and synthetic dyes, pigments, and metal ion compounds do absorb visible light, which is what gives them colour. This is why we can use UV-vis spectrophotometry to study coloured substances!
Chromophores
Chromophores are specific groups of atoms within molecules that are responsible for absorbing UV-visible light. Different chromophores absorb light at different wavelengths, making them useful for identifying substances. Examples include carbon-carbon double bonds (), carbonyl groups (), and other functional groups.
Components of a UV-vis spectrophotometer
A UV-vis spectrophotometer consists of several key components working together:
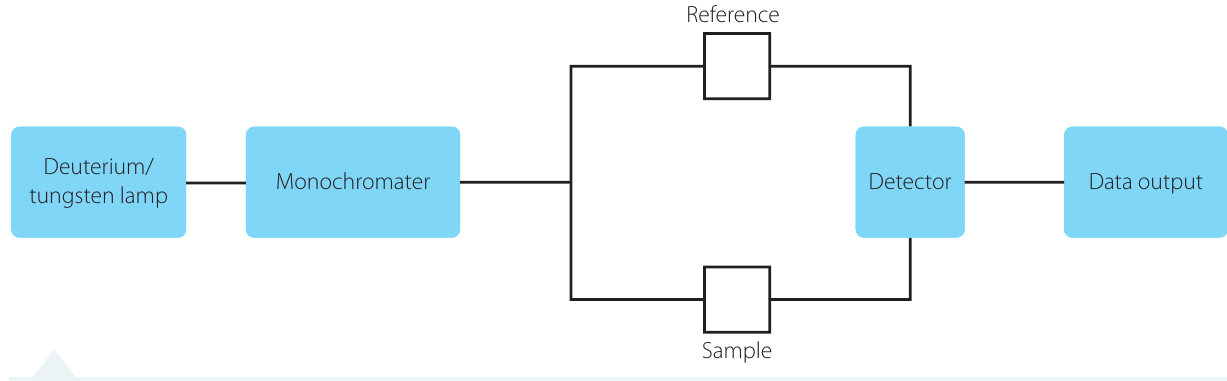
- Light source: A combination of tungsten/halogen and deuterium lamps provides light across the wavelength range of to nm
- Monochromator: A diffraction grating that splits the light into its component wavelengths
- Sample and reference cells: Light passes through two cells simultaneously - one containing the sample being analysed and the other containing only the pure solvent (the reference)
- Detector: Records the wavelengths at which absorption occurs and the amount of absorption at each wavelength
- Data output: A computer processes the information and displays the absorption spectrum
Calculating absorbance
The instrument calculates absorbance () at each wavelength using the following formula:
where:
- is the intensity of light before passing through the sample
- is the intensity of light after passing through the sample
Notice that absorbance has no units because it's the logarithm of a ratio. The resulting spectrum shows a graph of absorbance against wavelength.
The Beer-Lambert Law
The Beer-Lambert Law provides the mathematical relationship between absorbance and concentration. This relationship is fundamental to using UV-vis spectrophotometry for quantitative analysis.
The equation
The Beer-Lambert Law:
where:
-
is absorbance (no units, as it's a logarithmic ratio)
-
(epsilon) is the molar absorptivity (also written as ). This is a constant specific to each chemical substance. It measures how much light a solution absorbs per unit concentration. Units:
-
is the path length - the distance light travels through the sample. Measured in centimetres (cm). Most standard sample holders have a path length of cm
-
is the concentration of the solution. Units:
The direct relationship
Since both and are constants for a given investigation, the Beer-Lambert Law shows that absorbance is directly proportional to concentration:
This means:
- Higher concentration → more molecules/ions to absorb light → greater absorbance
- Lower concentration → fewer molecules/ions to absorb light → lower absorbance
This direct relationship is the foundation for using UV-vis spectrophotometry to determine unknown concentrations. By measuring absorbance, we can calculate concentration, and vice versa. This makes the technique incredibly useful for quantitative analysis in chemistry, biology, and environmental science.
Using UV-vis spectrophotometry for analysis
Identifying substances using
The wavelength at which a substance shows its maximum absorbance is called (lambda max). This characteristic wavelength acts like a fingerprint for identifying substances.
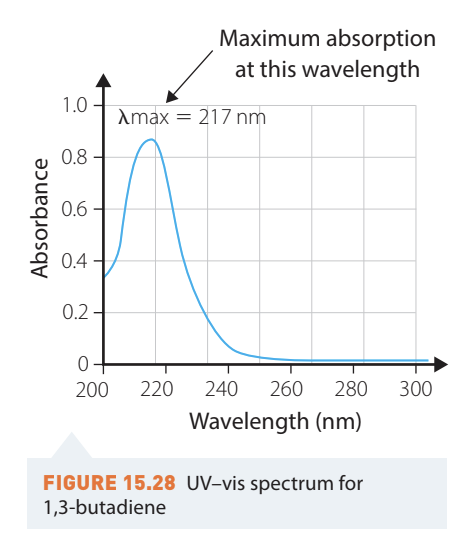
The diagram above shows the UV-vis absorption spectrum for -butadiene (). Notice how the maximum absorption occurs at nm.
To identify an unknown substance:
- Record the UV-vis spectrum of the unknown sample
- Determine the of the unknown
- Compare this spectrum to reference spectra of known compounds
- If the spectra match (same and similar shape), the identity is confirmed
Chromophore wavelengths
Different functional groups (chromophores) absorb light at characteristic wavelengths. Here are some common examples:
| Chromophore | Example | (nm) |
|---|---|---|
| (methane) | ||
| (carbon bonded to heteroatom) | (methanol) | |
| (methylamine) | ||
| (iodomethane) | ||
| (ethene) | ||
| (butadiene) | ||
| (formaldehyde) | ||
| Various compounds | ||
| Nitro compounds |
Exam tip: Notice how conjugated systems (molecules with alternating single and double bonds) generally absorb at longer wavelengths than isolated double bonds. This is because conjugation lowers the energy gap between electron levels.
Determining unknown concentrations
UV-vis spectrophotometry can determine the concentration of an unknown sample by comparing it to a calibration curve. Here's the process:
Step 1: Prepare standard solutions
Create a series of solutions with known concentrations of the substance you're measuring.
Step 2: Measure absorbance
Set the spectrophotometer to the for your substance (to get maximum sensitivity). Measure the absorbance of each standard solution.
Step 3: Create a calibration curve
Plot absorbance (y-axis) versus concentration (x-axis). Draw a line of best fit through the data points.
Step 4: Measure unknown sample
Measure the absorbance of your unknown sample at the same wavelength.
Step 5: Determine concentration
Use the calibration curve to find the concentration that corresponds to your unknown's absorbance.
Worked Example: Determining Nitrate Concentration in a Waterway
Consider a situation where a factory is suspected of releasing untreated waste nitrate into a local waterway. Water samples collected downstream showed an average absorbance of .
Standard solutions of nitrate were prepared and measured:
| (mg mL) | |||||||
|---|---|---|---|---|---|---|---|
| Absorbance |
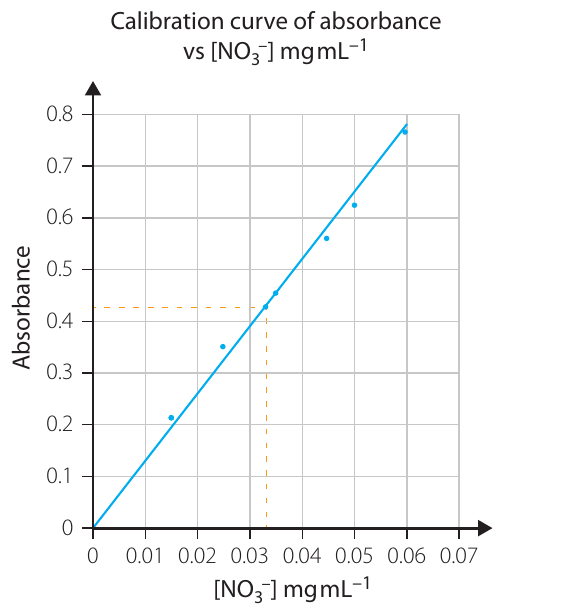
Solution approach:
The calibration curve shows the linear relationship between concentration and absorbance. By finding where absorbance intersects the line, we can read off the corresponding concentration (approximately mg mL).
Important note: Your exact answer will depend on your line of best fit. Always draw your line carefully through the origin (as absorbance should be zero when concentration is zero) and through the centre of the data points. Small variations in how you draw the line will affect your final answer.
Practical applications
Wine analysis
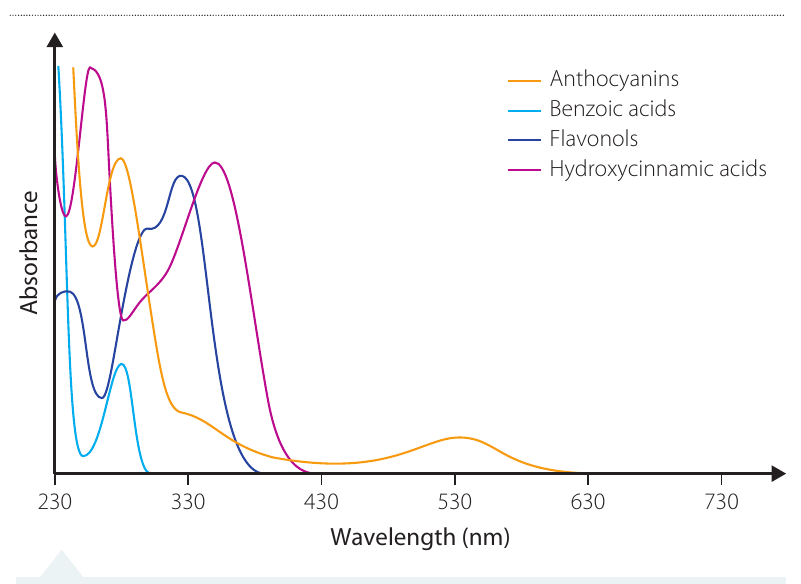
UV-vis spectrophotometry is valuable in the wine industry for quality control and variety identification. Phenolic compounds in wine influence both colour and taste, and different wines contain different phenolic profiles.
The main phenolic compounds in wine include:
| Phenolic compound | Typical wavelength (nm) |
|---|---|
| Anthocyanins | and |
| Benzoic acids | |
| Hydroxycinnamic acids | and |
| Flavonols | and |
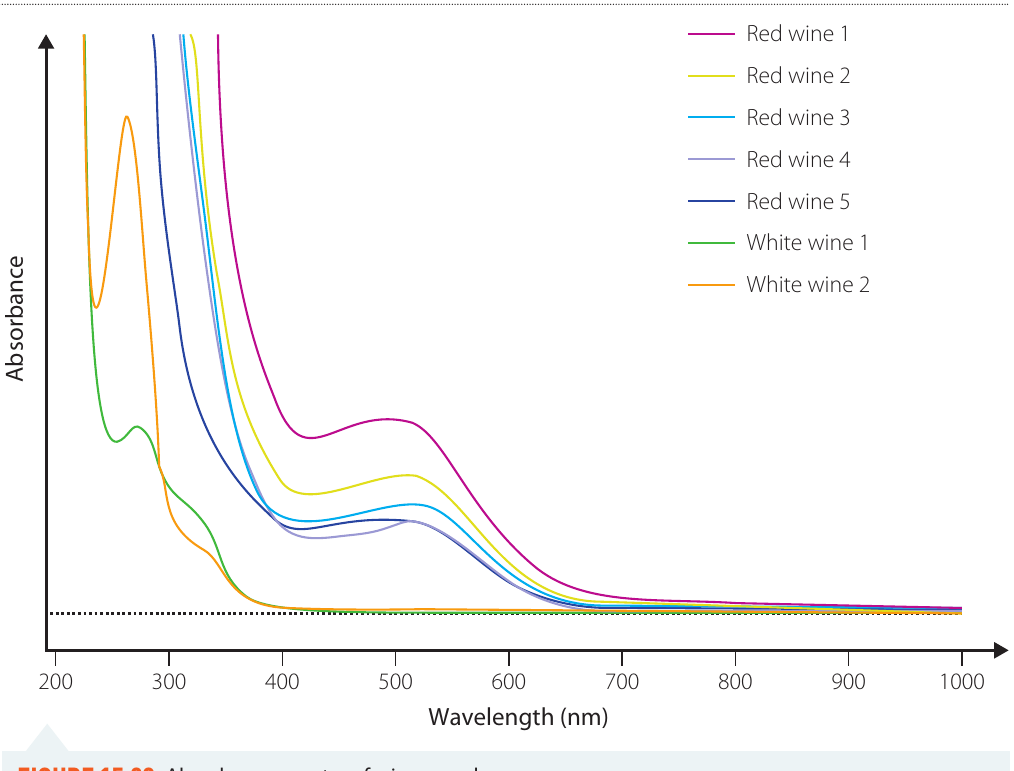
The absorption spectra of wine samples show clear differences between red and white wines. Red wines show significantly higher absorbance in the nm range, which corresponds to anthocyanins - the compounds responsible for red colour.
By comparing wine spectra to the spectra of pure phenolic compounds, winemakers can:
- Identify which phenolic compounds are present
- Determine relative concentrations of different compounds
- Distinguish between wine varieties
- Monitor wine quality during production
Environmental monitoring
UV-vis spectrophotometry is widely used for environmental testing. For example, monitoring nitrate levels in waterways helps identify pollution from agricultural runoff or industrial waste.
The technique is particularly useful because:
- It provides rapid results
- It's sensitive enough to detect low concentrations
- It's relatively inexpensive compared to other analytical methods
- It can be automated for continuous monitoring
Exam tip: When answering questions about applications, always explain why UV-vis spectrophotometry is suitable for that particular analysis. Consider factors like: Does the substance have a chromophore? What wavelength does it absorb? Is it used for identification or quantification?
Practice applying your knowledge
Here's a question to test your understanding:
Practice Problem: Drug Testing
Drug testing involves identifying metabolic products in urine. A banned drug produces an ester that absorbs at nm. Standard solutions gave the following data:
| Concentration of ester (mol L) | |||||
|---|---|---|---|---|---|
| Absorbance |
If a urine sample showed an absorbance of :
- Create a calibration curve by plotting the data
- Use the curve to determine the ester concentration
- If the ester to drug ratio is , calculate the original drug concentration
Approach: Plot absorbance vs concentration, draw a line of best fit, find where absorbance intersects your line, then use stoichiometry to calculate the drug concentration from the ester concentration.
Key Concepts
Remember These Key Points:
-
UV-vis spectrophotometry measures absorbance of UV and visible light ( nm) to determine concentrations of substances
-
Chromophores are the atoms responsible for absorption - different functional groups absorb at different wavelengths
-
The Beer-Lambert Law () shows that absorbance is directly proportional to concentration when path length and molar absorptivity are constant
-
is the wavelength of maximum absorption and can be used like a fingerprint to identify substances
-
Calibration curves allow determination of unknown concentrations by comparing their absorbance to standards of known concentration
-
Applications include pharmaceutical quality control, wine analysis, and environmental monitoring - any situation where you need to identify or quantify substances with chromophores