The Balance of Payments (HSC SSCE Economics): Revision Notes
The Balance of Payments
What is the balance of payments?
The balance of payments records all transactions between Australia and the rest of the world over a given time period. It shows both trade flows and financial flows in and out of the Australian economy.
Key principle: All money flowing into Australia is recorded as a credit (positive), while all money flowing out is recorded as a debit (negative, shown with a minus sign).
Example: Understanding Credits and Debits
When Australia exports iron ore to China, the payment received is a credit. When Australia imports cars from Japan, the payment made is a debit.
The balance of payments consists of two main accounts:
- The current account
- The capital and financial account
These accounts follow international accounting standards, making it easier to compare Australia's position with other countries.
The current account
The current account shows receipts and payments for trade in goods and services, transfer payments and income flows between Australia and the rest of the world. These transactions are non-reversible – once completed, they cannot be undone.
Components of the current account
Net goods
This measures the difference between export receipts and import payments for goods (physical products).
Three possible outcomes exist:
- Surplus: Export receipts exceed import payments
- Deficit: Import payments exceed export receipts
- Balance: Export receipts equal import payments
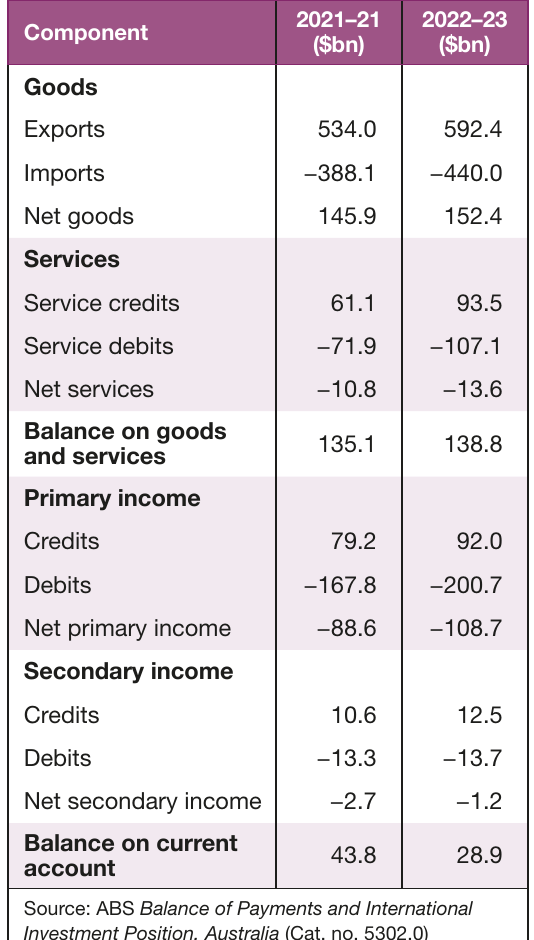
In 2022–23, Australia recorded a net goods surplus of $152.4 billion.
Net services
This covers transactions involving services rather than physical goods – including transport, travel, insurance, telecommunications and education.
- Service credits: Services Australia sells to foreigners (inflow)
- Service debits: Services Australia buys from overseas (outflow)
In 2022–23, Australia had a net services deficit of $13.6 billion, meaning service imports exceeded service exports.
Balance on goods and services (BOGS)
The BOGS combines net goods and net services. This is also called the trade balance.
In 2022–23, Australia recorded a BOGS surplus of $138.8 billion.
Net primary income
This records income earned from factors of production, particularly returns on investments:
- Interest payments on overseas borrowings
- Dividends and profits from foreign-owned companies in Australia
- Returns from Australian investments overseas
When foreigners invest in Australia, income flows overseas in the form of rent, profits, interest and dividends. When Australians invest overseas, income flows back to Australia.
In 2022–23, the net primary income deficit was $108.7 billion, reflecting Australia's high level of foreign ownership.
Net secondary income
This covers non-market transfers where no specific good or service is provided in return:
- Insurance claim payouts
- Workers' remittances (e.g., foreigners working in Australia sending money home)
- Foreign aid given by Australia
- Pensions received from foreign governments
This is a relatively small component. In 2022–23, the deficit was $1.2 billion.
Balance on current account
This is calculated by adding all current account components:
In 2022–23, Australia recorded a current account surplus of $28.9 billion.
The capital and financial account
The capital and financial account records borrowing, lending, sales and purchases of assets between Australia and the rest of the world. These transactions are reversible – they can be undone in the future (e.g., loans can be repaid, assets can be sold).
The capital account
The capital account has two main components:
- Capital transfers: Mainly conditional foreign aid grants linked to specific projects (e.g., funding infrastructure in developing countries) and debt forgiveness
- Non-produced, non-financial assets: Purchases and sales of intellectual property rights including patents, copyrights, trademarks and franchises
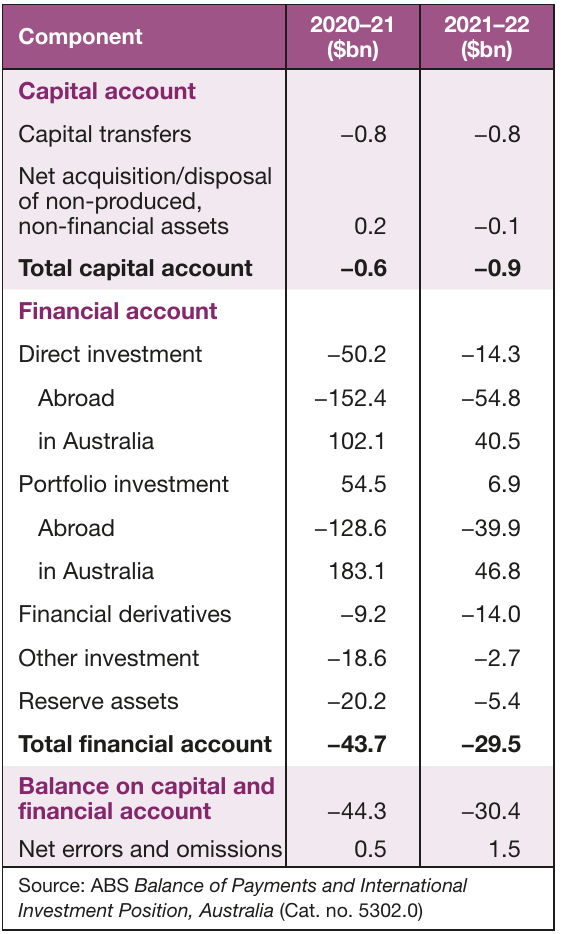
In 2021–22, the capital account recorded a deficit of $0.9 billion.
The financial account
The financial account shows Australia's transactions in foreign financial assets and liabilities, categorised into five types:
Direct investment
This covers financial transactions to fund new investment or to purchase more than 10% of shares in an existing company. It represents long-term, substantial investment.
Examples of Direct Investment
- A South Korean company funding construction of a motorway in Sydney
- BHP Billiton funding a copper mine in Indonesia
In 2021–22, there was a direct investment deficit of $14.3 billion.
Portfolio investment
This refers to buying land, shares and other marketable securities (easily sold assets) in existing companies, including most foreign debt. Portfolio investment typically involves the largest volume of transactions on the capital and financial account.
In 2021–22, portfolio investment recorded a surplus of $6.9 billion.
Financial derivatives
These are complex financial assets whose value derives from the performance of specific assets, interest rates, exchange rates or indices. They have become increasingly important in global financial markets.
In 2021–22, financial derivatives showed a deficit of $14.0 billion.
Reserve assets
These are foreign financial assets controlled by the Reserve Bank of Australia for financing or regulating payment imbalances. They include:
- Monetary gold held by the RBA
- Special Drawing Rights
- Reserve positions in the IMF
- Foreign exchange held by the RBA
In 2021–22, reserve assets recorded a deficit of $5.4 billion.
Other investment
This residual category captures transactions not classified elsewhere, including:
- Trade credits
- Loans and financial leases
- Currency and deposits
- Other accounts payable and receivable
In 2021–22, this category showed a deficit of $2.7 billion.
Balance on capital and financial account
The overall balance is found by adding all categories together. Under a floating exchange rate system, this should approximately equal the current account balance (with opposite sign).
In 2021–22, the capital and financial account deficit was $30.4 billion.
Net errors and omissions
This small balancing item accounts for statistical discrepancies. Under a floating exchange rate, the balance of payments should sum to zero:
In 2021–22, net errors and omissions was $1.5 billion.
Links between the current account and capital and financial account
The balancing relationship
The two accounts must balance to zero (allowing for net errors and omissions). A current account deficit equals a capital and financial account surplus, and vice versa.
Why this happens: Under a floating exchange rate, equilibrium in the foreign exchange market requires:
This can be expressed as:
Rearranging:
Or simply:
The primary income connection
The strongest link between the two accounts appears in the net primary income component. Capital inflows create future outflows on the primary income account:
Foreign debt → Interest payments recorded as debits on primary income account
Foreign equity → Dividends and profits recorded as debits on primary income account
Over time, sustained capital and financial account surpluses will increase the net primary income deficit due to rising servicing costs on foreign liabilities.
The savings-investment perspective
Australia's persistent current account deficits (until recent years) reflected a gap between savings and investment. Low national savings meant Australia needed capital inflows to fund investment, resulting in:
- Capital and financial account surpluses
- Current account deficits
This perspective suggests the current account deficit is fundamentally a capital and financial account issue, not just a trade problem.
Trends in Australia's balance of payments
The balance of payments reflects the health of the economy and its relationship with the global economy. Analysis focuses mainly on the current account deficit and its components: the BOGS and net primary income.
Historical pattern
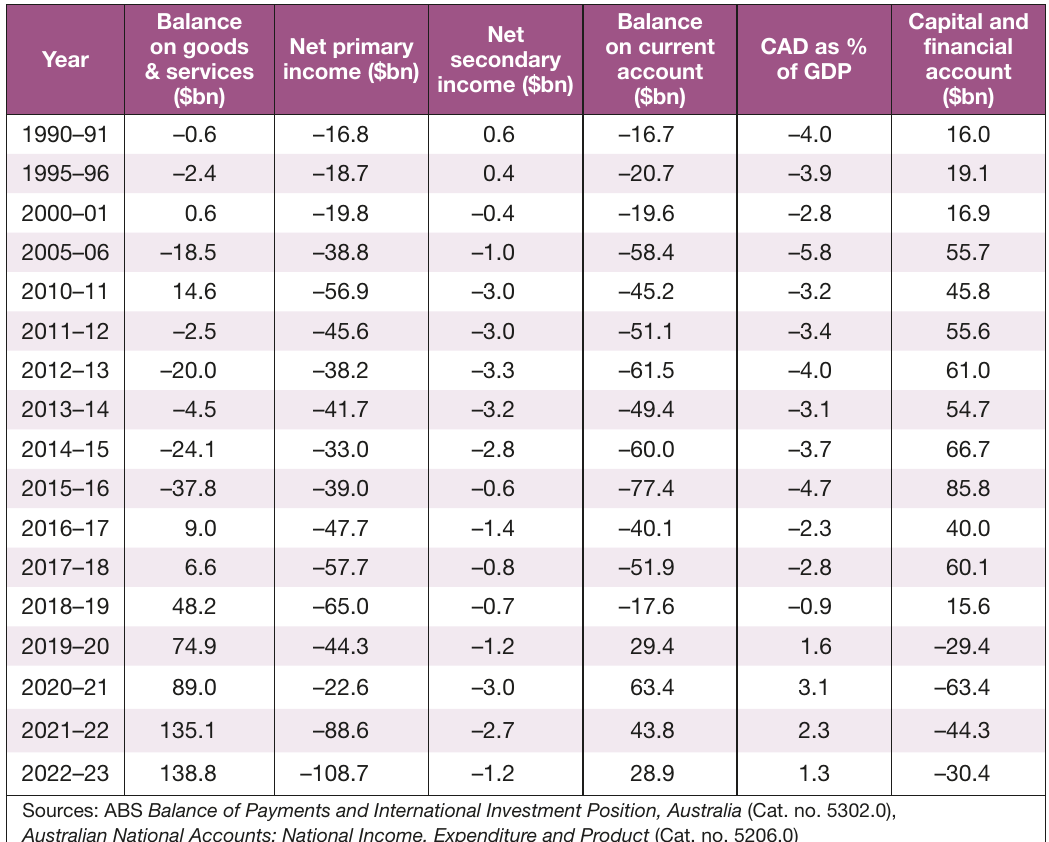
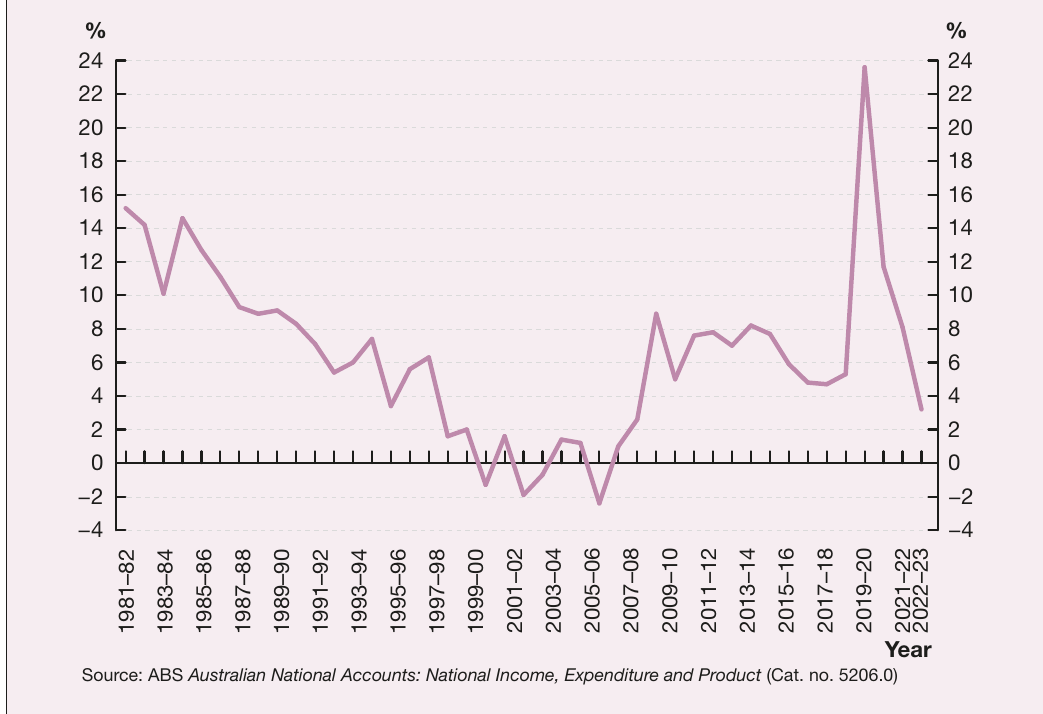
For decades prior to the 2010s, Australia's current account was consistently in deficit, averaging around 4% of GDP. After reaching a record deficit of 6.6% of GDP in 2007–08, sustained improvement began.
Between 2019–20 and 2022–23, Australia recorded four consecutive current account surpluses – the first since the early 1970s. This improvement was driven by:
- Strong commodity prices
- Low global interest rates
- A larger contraction in imports than exports during COVID-19
- Continued commodity price strength post-pandemic
Treasury forecasts a return to deficit (2.5% of GDP) in 2023–24 due to weaker commodity prices and higher debt servicing costs from rising interest rates.

Cyclical versus structural factors
Cyclical factors vary with the level of economic activity (e.g., commodity demand, terms of trade, exchange rate).
Structural factors are persistent underlying influences (e.g., export base structure, international competitiveness, national savings level).
The balance on goods and services
The BOGS has been consistently in surplus since 2016–17, averaging 3.4% of GDP. This reflects strong growth in resources and energy export income. The 2022–23 surplus of $138.8 billion was the highest on record.
Cyclical factors affecting BOGS
Exchange rate
Exchange rate movements affect international competitiveness:
- Depreciation → Exports become cheaper in foreign currency (more competitive) and imports become more expensive in AUD (less attractive) → BOGS improves
- Appreciation → Opposite effect → BOGS worsens
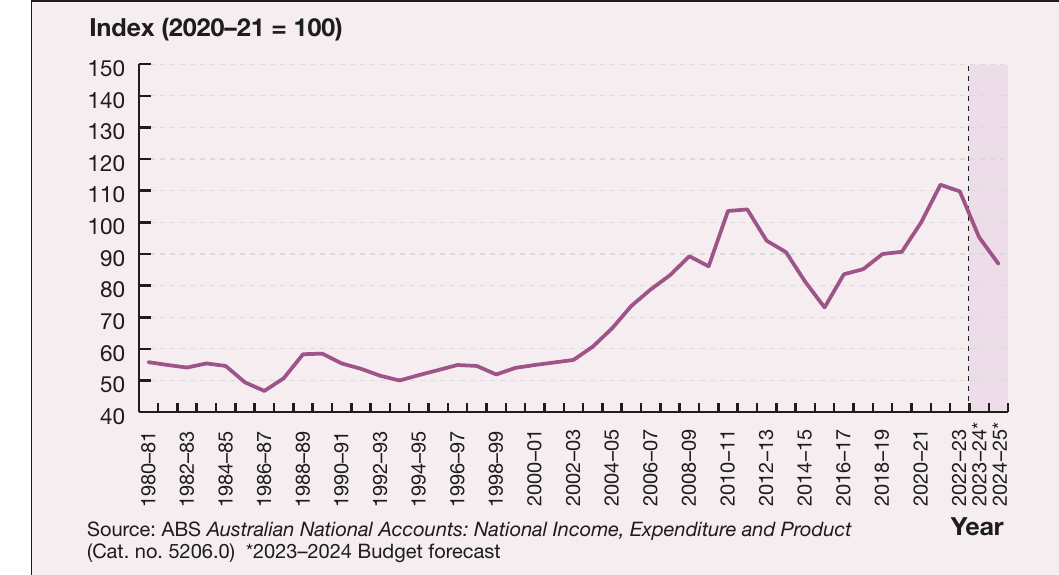
Terms of trade
The terms of trade measures the relationship between export prices and import prices. It is the most significant influence on Australia's balance of payments in recent years.
Definition: The terms of trade index shows the ratio of export prices to import prices.
Interpretation:
- Rising index → Terms of trade improving (export prices rising faster than import prices)
- Falling index → Terms of trade deteriorating (import prices rising faster than export prices)
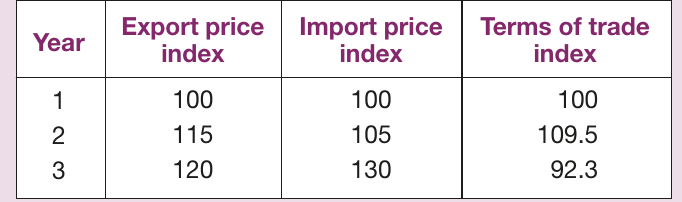
Worked Example: Calculating the Terms of Trade
| Year | Export price index | Import price index | Terms of trade index |
|---|---|---|---|
| 1 | 100 | 100 | 100 |
| 2 | 115 | 105 | 109.5 |
| 3 | 120 | 130 | 92.3 |
Step 1: Calculate the terms of trade for Year 2
Step 2: Calculate the terms of trade for Year 3
Interpretation: In this example, the terms of trade improved in Year 2 but deteriorated in Year 3, with import prices rising faster than export prices.
Impact on BOGS:
- Improvement in terms of trade → Same export volume earns more revenue → BOGS improves (unless export volumes fall significantly)
- However, higher terms of trade also increases demand for AUD → appreciation → reduces competitiveness of non-commodity exports
Australia's terms of trade boom:
Since 2003, Australia has experienced the largest sustained terms of trade boom in its history. By 2023, the terms of trade was almost double its 2003 level, driven by:
- Rising global commodity prices (especially from China's growth)
- Low-cost manufactured imports from emerging economies
- COVID-19 recovery driving commodity demand
- Russia-Ukraine conflict disrupting energy supplies
Economic growth rates
Domestic growth → Higher business investment and consumption → More imports → BOGS worsens (but may improve later if investment increases export capacity)
Global growth → Higher demand for Australian exports → More export revenue → BOGS improves
Australia's close integration with fast-growing Asian economies has supported export growth.
Structural factors affecting BOGS
Narrow export base
Australia's exports are heavily weighted towards a small number of commodities. Minerals and agriculture together account for around two-thirds of export earnings.
Implications:
- High exposure to price and demand volatility in commodity markets
- Large fluctuations in BOGS from year to year
- Dependence on finite resources (especially fossil fuels)
Challenges ahead:
- As global economies transition away from fossil fuels, Australia cannot rely on coal and gas exports
- Climate change is affecting agricultural productivity
- Need to diversify towards high-value-added exports (technology, services, elaborately transformed manufactures)
Services export growth: Services exports provide strong diversification opportunities given Australia's proximity to growing Asian economies. Services exports peaked at $96.6 billion in 2018–19 (before COVID-19), fell to $61.1 billion in 2021–22, then rebounded to $93.5 billion in 2022–23.
Lack of international competitiveness
Australia lacks international competitiveness in manufacturing. The economy:
- Imports value-added products (consumer goods, capital goods)
- Exports bulk commodities without value-adding
- Results in import payments often exceeding export revenues
Long-term solution: Diversify towards high-growth, high-value-added sectors including:
- Technology
- Elaborately transformed manufactures (ETMs)
- Services (especially to Asian markets)
Infrastructure matters: International competitiveness is also affected by infrastructure capacity (ports, rail, roads, broadband). Recent investment increases have helped alleviate constraints and facilitate export growth.
The primary income account
The primary income account plays a central role in Australia's current account trends. It mainly consists of interest and dividend payments on Australia's net foreign debt and equity.
Between 2004–05 and 2019–20, the net primary income deficit typically ranged between 2% and 3% of GDP. In 2022–23, it rose sharply to 4.9% of GDP.
Cyclical factors affecting primary income
Domestic economic growth
Strong domestic growth → Higher company profits → Higher dividends paid to foreign shareholders (approximately 40% of Australian share market is foreign-owned) → Larger primary income deficit
The foreign-owned mining sector generates particularly large dividend outflows when commodity prices are high.
Exchange rate movements
The valuation effect occurs when the exchange rate changes the AUD value of foreign-currency-denominated debt:
- Appreciation → Foreign debt costs less in AUD terms → Servicing costs fall → Primary income deficit decreases
- Depreciation → Foreign debt costs more in AUD terms → Servicing costs rise → Primary income deficit increases
However, this effect is limited because:
- Much of Australia's foreign debt is "hedged" (exchange rate fixed for the loan period)
- Significant foreign debt is denominated in AUD (unaffected by exchange rate)
Interest rate changes
Changes in domestic and global interest rates directly affect debt servicing costs.
Recent Example: Impact of Rising Interest Rates
Net debt servicing costs almost doubled from $18 billion to $33 billion in 2022–23 as interest rates rose sharply in both Australia and overseas.
Structural factors affecting primary income
Savings-investment gap
The main structural reason for Australia's persistent primary income deficit is low national savings combined with high investment requirements.
The mechanism:
- Australia is a small economy with historically low national savings
- The economy (especially the mining sector) requires high capital investment
- Investment needs exceed domestic savings
- Firms borrow from overseas (foreign debt) or sell ownership stakes (foreign equity)
- This creates servicing obligations: interest on debt, dividends on equity
- These servicing costs flow out through the primary income account
Partially offsetting factor: Australia's large superannuation funds have increasingly invested overseas, generating inflows of earnings that improve the net primary income balance.
Low household and public savings
Australian households are highly leveraged, with twice as much debt (as a proportion of income) as two decades ago.
COVID-19 impact: Household savings rose dramatically during the pandemic as spending opportunities decreased and government support payments were made. However, this increase was not sustained. Households spent their savings during the recovery, and rising interest rates and living costs reduced savings capacity.
Government savings: Australian governments substantially increased borrowing during the past decade, detracting from national savings. While COVID-19 required unprecedented spending, the speed of deficit reduction in the 2020s will influence the savings-investment gap and therefore the balance of payments.
Policy options to increase national savings:
- Increase compulsory superannuation rates
- Remove tax incentives that encourage debt
- Introduce tax incentives for savings
- Reduce budget deficits and move towards surplus (fiscal consolidation)
Remember!
Key Points to Remember:
-
The balance of payments records all transactions between Australia and the rest of the world, consisting of the current account (non-reversible transactions) and the capital and financial account (reversible transactions)
-
The current account includes net goods, net services, net primary income and net secondary income. The capital and financial account includes the capital account and financial account (direct investment, portfolio investment, financial derivatives, reserve assets and other investment)
-
The two accounts must balance to zero under a floating exchange rate system. A current account deficit equals a capital and financial account surplus
-
Australia's recent current account surpluses (2019–20 to 2022–23) were driven by strong commodity prices, but a return to deficit is forecast as commodity prices moderate and interest rates rise
-
The terms of trade (ratio of export prices to import prices) has been the most significant influence on Australia's balance of payments in recent decades. Australia experienced a sustained terms of trade boom from 2003, though this has shown volatility
-
Australia's persistent net primary income deficit reflects a structural savings-investment gap. Low national savings mean Australia relies on foreign capital inflows, which create future servicing obligations in the form of interest and dividends
-
Cyclical factors affecting the BOGS include the exchange rate, terms of trade and economic growth rates. Structural factors include Australia's narrow export base and lack of international competitiveness in manufacturing