Australia's Floating Exchange Rate System (HSC SSCE Economics): Revision Notes
Australia's Floating Exchange Rate System
What is a floating exchange rate?
An exchange rate is the price of one country's currency expressed in terms of another country's currency. It represents the rate at which traders and investors can swap one currency for another in the foreign exchange (forex) market.
Australia adopted a floating exchange rate system in December 1983, abandoning its previous managed flexible peg arrangement. This shift is widely regarded as one of the most significant structural changes in Australia's economic history because it opened the economy to global financial flows.
Under a floating system, the value of the Australian dollar is determined by market forces of supply and demand rather than government intervention. This means the exchange rate adjusts continuously in response to changing economic conditions and market sentiment.
How the floating exchange rate system operates
In a floating exchange rate system, supply and demand establish an equilibrium price for the Australian dollar (A$) in terms of another country's currency. The market mechanism works in the same way as for goods and services, but instead of determining the price of a product, it determines the price of currency.
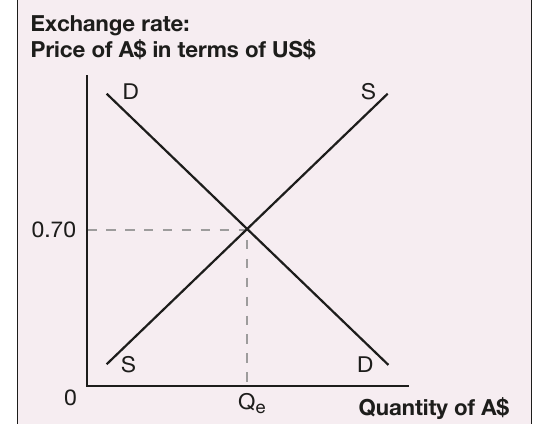
The diagram shows how the exchange rate between the Australian dollar and US dollar is determined. The downward-sloping demand curve (D) represents all those who wish to buy Australian dollars, while the upward-sloping supply curve (S) represents all those who wish to sell Australian dollars. The intersection point establishes the equilibrium exchange rate.
At equilibrium, the exchange rate is US$0.70, meaning A$1 can purchase US$0.70 (or alternatively, US$1 can purchase approximately A$1.43). This equilibrium changes regularly—sometimes hour by hour or even minute by minute—as supply and demand conditions in the foreign exchange market shift.
Factors affecting demand for the Australian dollar
Demand for Australian dollars comes from anyone who needs to buy the currency. The main sources of demand are:
Financial flows into Australia
Foreign investors who wish to invest in Australia must convert their currency into Australian dollars, creating demand for the A$. Several factors influence these financial inflows:
Interest rates: When Australian interest rates are higher relative to overseas interest rates, Australia becomes a more attractive destination for foreign savings. Higher returns on Australian investments increase demand for the A$. Conversely, relatively lower Australian interest rates reduce this demand.
Investment opportunities: The availability of profitable investment opportunities in Australia affects demand. When there are more opportunities to start new businesses or purchase shares in existing Australian companies, foreign investors need more Australian dollars, increasing demand.
Expectations: If market participants expect the Australian dollar to appreciate in the future, speculators will increase their current demand for A$. This speculative buying can actually contribute to the expected appreciation, creating a self-fulfilling prophecy.
Demand for Australian exports
Foreigners who purchase Australia's exports need to convert their currency into Australian dollars to pay Australian exporters. Several factors influence export demand:
Commodity prices and terms of trade: Changes in commodity prices have an immediate and significant effect on the Australian dollar. Australia is a major commodity exporter, with mineral and metal resources comprising half of all exports. A rise in commodity prices and an improvement in the terms of trade are associated with increased value of Australian exports. Financial markets often respond to these changes by increasing the value of the dollar based on expectations that export earnings will increase over the short to medium term.
International competitiveness: The degree of international competitiveness of Australian exporters influences export demand. If Australian firms are competitive in world markets, Australia's exports will be more attractive to foreign buyers. This competitiveness depends partly on Australia's inflation rate relative to overseas countries—if Australia's inflation is relatively low, Australian exports will generally be cheaper and more attractive to foreign buyers.
Global economic conditions: Demand for Australia's commodity exports is highly dependent on the growth rates of Australia's trading partners. When major economies like China are growing strongly, demand for Australian resources increases. Conversely, when the world economy experiences recession, demand and prices for Australia's exports fall, reducing demand for the A$.
Consumer preferences: Changes in the tastes and preferences of overseas consumers affect the demand for Australia's exports and therefore the demand for Australian dollars.
Factors affecting supply of the Australian dollar
Supply of Australian dollars comes from anyone who wishes to sell the currency. The main sources of supply are:
Financial flows out of Australia
Australian investors who wish to invest overseas must sell Australian dollars and purchase foreign currency, creating supply of the A$. Several factors influence these financial outflows:
Interest rates: When Australian interest rates are lower relative to overseas interest rates, investing savings overseas becomes more attractive to Australian investors. This increases financial flows out of Australia and hence increases the supply of A$.
Overseas investment opportunities: Greater opportunities to start businesses overseas or purchase shares in overseas companies increase financial flows out of Australia, raising the supply of A$ on the foreign exchange market.
Expectations: Speculators in the foreign exchange market who expect the value of the A$ to depreciate will sell A$, increasing supply and thus contributing to the anticipated depreciation.
Demand for imports
Australian importers who purchase goods and services from overseas need to sell Australian dollars to obtain foreign currencies for payment. Import demand is influenced by:
Domestic income levels: Strong economic growth and rising incomes and employment result in higher demand for imports, increasing the supply of A$ on the foreign exchange market. This is one of the most important determinants of import levels.
Inflation and competitiveness: If Australia's domestic inflation rate is higher and its import-competing firms are relatively uncompetitive, imports will be cheaper than domestic products. This increases demand for imports and therefore the supply of A$.
Consumer preferences: Changes in the tastes and preferences of domestic consumers affect import demand. An increasing preference for goods and services from overseas raises the supply of A$ on the foreign exchange market.
Currency appreciation and depreciation
The exchange rate adjusts when there are shifts in either the demand curve or the supply curve for Australian dollars. These movements are described as appreciation (when the currency strengthens) or depreciation (when the currency weakens).
Appreciation of the Australian dollar
Appreciation occurs when the value of the A$ increases relative to another currency. This can happen through two mechanisms:
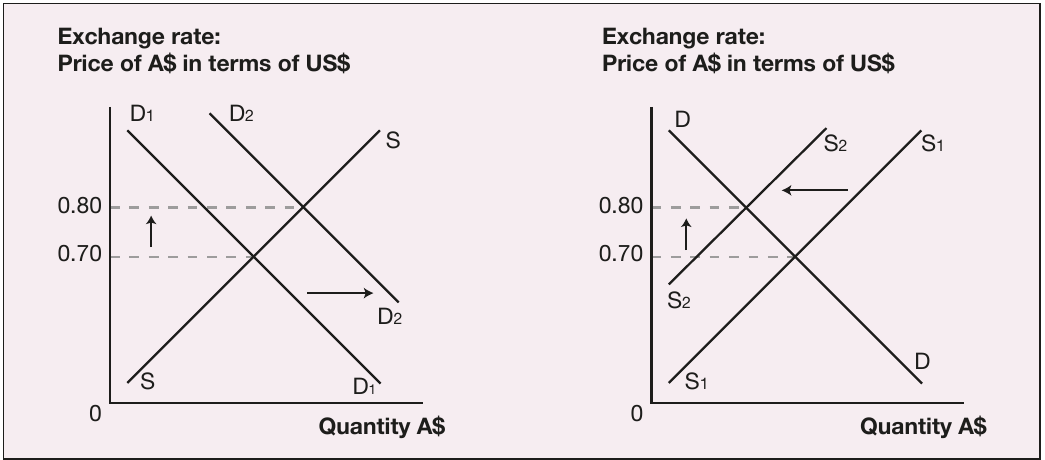
Understanding Appreciation Mechanisms:
Mechanism 1 - Increase in demand: Any increase in demand for A$ (shift in the demand curve to the right, from to ) increases the price of A$ in terms of other currencies. The left panel shows this demand shift causing appreciation from US$0.70 to US$0.80.
Mechanism 2 - Decrease in supply: Any decrease in the supply of A$ (shift in the supply curve to the left, from to ) also causes appreciation. The right panel demonstrates this supply shift producing the same appreciation from US$0.70 to US$0.80.
Both mechanisms result in the Australian dollar strengthening from US$0.70 to US$0.80.
Depreciation of the Australian dollar
Depreciation occurs when the value of the A$ decreases relative to another currency. This also happens through two mechanisms:
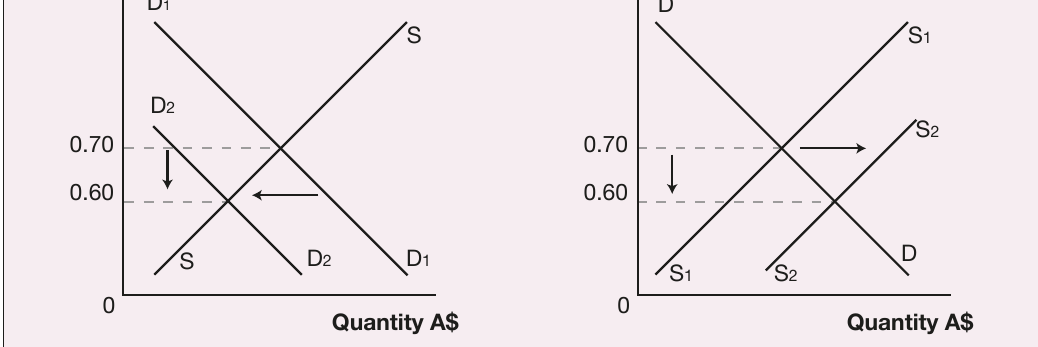
Understanding Depreciation Mechanisms:
Mechanism 1 - Decrease in demand: Any decrease in demand for A$ (shift in the demand curve to the left, from to ) decreases the price of A$ in terms of other currencies. The left panel shows this demand shift causing depreciation from US$0.70 to US$0.60.
Mechanism 2 - Increase in supply: Any increase in the supply of A$ (shift in the supply curve to the right, from to ) also causes depreciation. The right panel demonstrates this supply shift producing the same depreciation from US$0.70 to US$0.60.
Both mechanisms result in the Australian dollar weakening from US$0.70 to US$0.60.
Summary of key factors
| APPRECIATION | DEPRECIATION |
|---|---|
| Increase in Australian interest rates or decrease in overseas interest rates | Decrease in Australian interest rates or increase in overseas interest rates |
| Improved investment opportunities in Australia or deterioration in foreign opportunities | Deterioration in investment opportunities in Australia or improvement in foreign opportunities |
| Rise in commodity prices and improvement in Australia's terms of trade | Fall in commodity prices and deterioration in Australia's terms of trade |
| Improvement in Australia's international competitiveness | Deterioration in Australia's international competitiveness |
| Lower inflation in Australia | Higher inflation in Australia |
| Increased demand for Australia's exported goods and services | Increased demand for imported goods and services |
| Expectations of currency appreciation based on forecasts | Expectations of currency depreciation based on forecasts |
The floating exchange rate as an automatic stabiliser
A floating exchange rate acts as an "automatic stabiliser" that helps protect the economy from external economic shocks. A prime example occurred during Australia's mining boom from the mid-2000s to the early 2010s. The surge in demand for Australian resources pushed commodity prices upward, which caused the dollar to appreciate. This appreciation increased costs and reduced demand for industries outside the mining sector. The currency appreciation helped the economy reallocate labour and capital toward the booming mining sector, reducing inflationary pressures and maintaining stable overall employment levels.
The trade weighted index (TWI)
Australia has many different exchange rates—one for each currency with which it trades. At any given time, the Australian dollar may be appreciating against some currencies while depreciating against others. For example, in April 2023, the Australian dollar appreciated against the Japanese yen but depreciated against the British pound.
Comparing the dollar's value against a single currency (such as the US dollar) can create a misleading impression of overall trends. This is because both currencies are influenced by their own unique factors. For instance, during the 2000s the US dollar depreciated significantly against most currencies. Examining only the A$/US$ exchange rate might suggest the Australian dollar appreciated by over 100% during the decade to 2011, when in fact the Australian dollar was rising whilst the US dollar was falling simultaneously, creating an exaggerated impression of the A$'s strength.
The Trade Weighted Index (TWI) provides a more accurate indication of how the Australian dollar is moving against currencies in general. The TWI measures the value of the A$ against the currencies of Australia's major trading partners compared with a base year (May 1970 = 100).
Currencies of countries that feature more prominently in Australia's trade receive higher weightings in the TWI calculation, giving them greater influence on the index. The Reserve Bank of Australia recalculates these weightings annually based on the previous financial year's trade volumes.
Currency weightings
| Currency | Trade weights (%) 2022–23 |
|---|---|
| Chinese renminbi | 30.7 |
| United States dollar | 12.5 |
| Japanese yen | 9.2 |
| European euro | 8.2 |
| South Korean won | 7.3 |
| United Kingdom pound sterling | 5.1 |
| Singapore dollar | 5.1 |
| New Zealand dollar | 3.7 |
| Indian rupee | 2.9 |
| Thai baht | 2.7 |
Source: Reserve Bank of Australia 2023
The table shows that the Chinese renminbi has the highest weighting (30.7%), reflecting China's position as Australia's largest trading partner. The US dollar (12.5%) and Japanese yen (9.2%) also feature prominently. Over the last two decades, the relative significance of the yen and US dollar has declined, while the Chinese renminbi has become increasingly important.
In 2023, the TWI calculation included 17 countries, which together accounted for at least 90% of Australian trade.
Limitations of the TWI
The TWI has an important limitation: weightings are based solely on trade volumes, regardless of the currency in which exports and imports are actually invoiced. In reality, Australia often sells its commodities in US dollars even when trading with countries like Japan or South Korea. Almost 90% of Australia's merchandise exports and more than half of imports are priced in US dollars.
This means the A$/US$ exchange rate is far more important to Australia's trade performance than its weight in the TWI suggests. This discrepancy must be considered when analysing the impact of exchange rate movements on Australia's trade and financial flows.
Recent movements in the Australian dollar
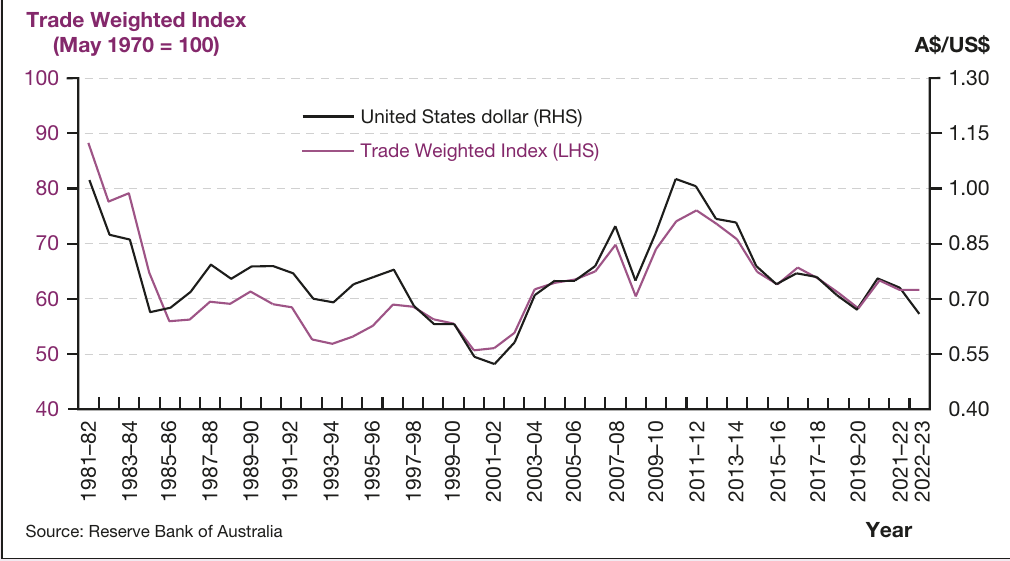
The Australian dollar experienced substantial volatility over the past four decades. After hitting a low of US$0.47 in 2001, the dollar began appreciating strongly from 2003 as commodity prices increased during the resources boom. The global financial crisis in 2009 caused a sharp fall, with the dollar losing one-third of its value against the US dollar. However, it swiftly recovered, peaking at US$1.10 in 2011.
From 2011, the dollar entered a depreciation trend, falling during the mid-2010s into a range between US$0.70–0.80. The COVID-19 pandemic saw the dollar briefly depreciate to just US$0.55 in March 2020—its lowest level since 2002. It recovered by early 2021 to almost US$0.80, before depreciating again to around US$0.65 by mid-2023.
Key drivers of recent movements
Commodity prices have played a critical role in exchange rate volatility. As a significant commodity exporter, with mineral and metal resources comprising half of all exports, Australia's terms of trade and export performance are strongly influenced by commodity prices. During the resources boom, commodity prices soared to over three times their pre-2003 value, fuelling demand for Australian dollars from both trade and speculative investment.
More recently, the war in Ukraine (beginning in 2022) led many countries to impose sanctions on Russia, a major commodity exporter. This increased demand for Australia's commodity exports such as coal, gas and iron ore, contributing to a 7.5% appreciation of the Australian dollar from January to March 2022. The dollar's depreciation over the first half of 2023 coincided with lower iron ore and coal prices, demonstrating the ongoing significance of this relationship.
Interest rate differentials have also influenced the dollar's value. When Australia's cash rate exceeds that of other advanced economies, foreign investors (particularly from high-savings nations like Japan) are more likely to invest their savings in Australia. This phenomenon, known as "carry trade", provided strong support for the Australian dollar over the past two decades. However, when Australian interest rates fell below levels in most other advanced economies during 2022–23, this created downward pressure on the Australian dollar.
Global economic uncertainty and financial market volatility have increasingly influenced short-term movements. While long-term economic factors such as growth, commodity prices and investment returns remain important, their main impact often occurs through their influence on global financial markets, where speculators tend to focus on short-term factors rather than long-term economic fundamentals.
Remember!
Key Points to Remember:
-
Floating exchange rate system: Australia adopted a market-determined exchange rate in December 1983, allowing supply and demand to set the currency's value without direct government control.
-
Demand factors: The A$ appreciates when there are increases in Australian interest rates (relative to overseas), improved investment opportunities in Australia, rising commodity prices and terms of trade, improved international competitiveness, lower domestic inflation, increased export demand, or expectations of future appreciation.
-
Supply factors: The A$ depreciates when there are decreases in Australian interest rates (relative to overseas), deteriorating investment opportunities in Australia, falling commodity prices and terms of trade, reduced international competitiveness, higher domestic inflation, increased import demand, or expectations of future depreciation.
-
Trade Weighted Index (TWI): The TWI provides a more accurate measure of the Australian dollar's overall value than any single bilateral exchange rate by weighting currencies according to their importance in Australia's trade (Chinese renminbi 30.7%, US dollar 12.5%, Japanese yen 9.2% as of 2022–23).
-
Recent trends: The Australian dollar appreciated strongly during the 2000s commodity boom (peaking at US$1.10 in 2011), then depreciated through the 2010s and early 2020s (falling to around US$0.65 by mid-2023), with commodity prices remaining the primary driver of these movements.