Wage Outcomes (HSC SSCE Economics): Revision Notes
Wage Outcomes
Wages and salaries represent the most important source of income in Australia, accounting for approximately 56% of household incomes. This makes wage outcomes in the labour market the single most influential factor in how income is distributed throughout Australian society. Understanding wage outcomes requires examining both the price of labour (wage levels and benefits) and the quantity of labour (employment levels and hours worked).
The dominance of wage income in Australian households means that changes in wage outcomes have far-reaching effects on income distribution, living standards, and economic inequality across society.
Understanding nominal and real wages
When examining wage outcomes, it is crucial to distinguish between two different measures of wages: nominal wages and real wages.
Nominal wage refers to the pay received by employees in dollar terms for their contribution to the production process, without adjusting for inflation. For example, if you earn $1,200 per week, this is your nominal wage.
Real wage is a measure of the actual purchasing power of money wages—that is, nominal wages adjusted for the effects of inflation. Real wages tell us whether workers are genuinely better off over time, because they account for changes in the cost of living.
The distinction matters because nominal wages can increase while real wages decrease. This occurs when inflation rises faster than wage growth, meaning workers' money buys less despite earning more dollars.
Average weekly earnings trends
In 2019, the average total earnings for all Australian employees was $1,238 per week. This figure represents the average weekly gross rate of pay (before tax) to all employees, both full-time and part-time, including overtime payments.
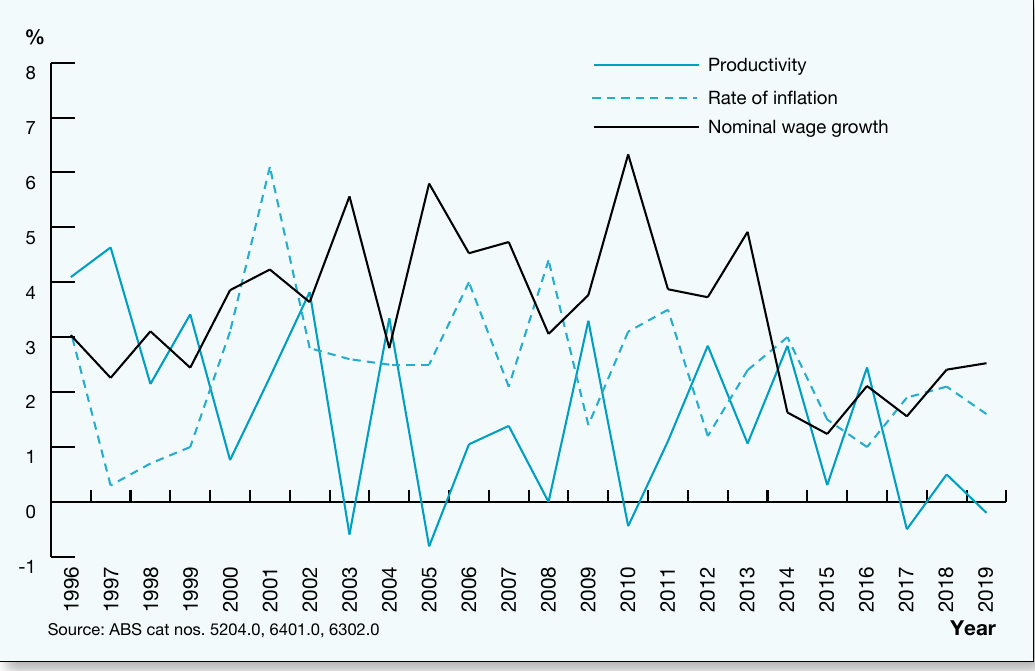
The graph above shows three important economic indicators over the period 1996-2019:
- Nominal wage growth (black line) has averaged 2.6% annually over the past two decades, but slowed to just 1.6% annually in the five years to 2019—a historically low rate.
- Inflation (dashed teal line) peaked around 6.2% in 2001 but has generally declined to around 2-3% by 2019.
- Productivity growth (solid teal line) has been volatile, ranging from negative growth to over 6% at various points.
Understanding the Three-Way Relationship
The relationship between these three variables is critical. When nominal wage growth exceeds inflation, real wages are rising and workers are better off. However, there have been three occasions in the past decade when inflation has outstripped wage growth, meaning real wages fell.
The productivity-wage relationship
Labour productivity refers to the quantity of output produced per unit of labour per unit of time. The relationship between productivity and wages determines real labour costs for employers.
Employers can afford to pay higher real wages when productivity increases strongly. If real wage growth exceeds productivity growth, real labour costs rise and eat into profits. This creates pressure on employers to either accept lower profits or reduce employment and increase use of technology, potentially leading to higher unemployment (labour pricing itself out of jobs).
When wage growth is below the combined rate of inflation and productivity growth, real labour costs fall and profits expand. In most years shown in the graph, nominal wage growth has been less than the combined change in prices and productivity, meaning real labour costs have been falling.
However, in occasional years like 2018-19, when productivity growth was negative, wages growth can exceed the sum of inflation and productivity growth.
Wage differentials between occupations
The labour market consists of many different micro-markets, each with its own supply and demand conditions. This results in significant wage differentials between different occupations.
Several factors explain why different occupations command different wage levels:
Skills and education requirements: Occupations requiring higher levels of education and longer training periods generally pay more. Workers will not invest time and money acquiring skills unless they expect either higher wages or other benefits (such as more satisfying work). For example, becoming a doctor requires many years of university study and training, which is reflected in higher pay.
Working conditions: Some occupations involve less appealing conditions—they may be dangerous, dirty, or involve irregular hours. Workers in these occupations often receive higher wages as compensation. This is known as a compensating differential.
Occupational mobility: This refers to the ease with which labour can move from one occupation to another. When occupational mobility is high, labour supply is abundant and wages tend to be lower. When mobility is restricted (for example, in highly specialised professions like veterinary surgery, accounting, or law), labour supply is limited and wages tend to be higher.
Executive compensation: A small number of roles receive dramatically higher pay. A 2018 survey found that the median pay for CEOs of Australia's top 100 publicly listed companies was $4.4 million per year—66 times median wages for Australian workers.
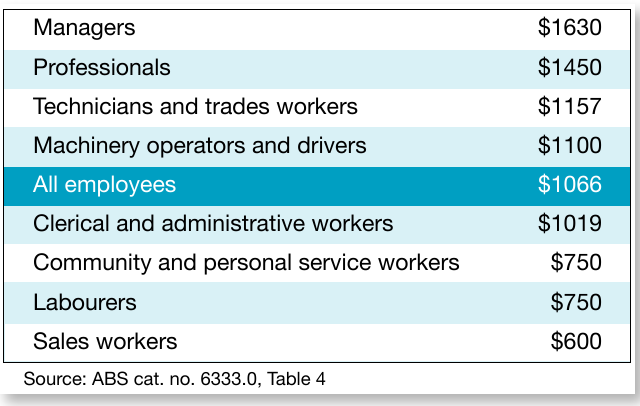
Wage Hierarchies Across Occupational Groups (2018)
The table above shows clear wage hierarchies across occupational groups:
- Managers earn the highest median weekly income ($1,630), reflecting the experience and skills required
- Professionals earn $1,450 per week, again reflecting high skill requirements
- Sales workers earn the lowest wages ($600 per week), due to lower skill requirements and high occupational mobility
- The overall employee median is $1,066 per week
This demonstrates that income distribution is markedly unequal across different occupation groups, with managers earning more than 2.7 times what sales workers earn.
Wage differentials within the same occupation
Even within the same occupation, wages can differ significantly based on several factors:
Experience and qualifications: More experienced workers are generally considered more valuable and are paid more. Similarly, workers with higher qualifications within their field typically earn higher wages than those with basic qualifications.
Geographic mobility: This refers to the ease with which labour can move from one area to another. Employers in isolated locations find it difficult to attract workers and must pay higher wages.
Geographic Mobility and the Mining Boom
During the mining boom in 2011, mining companies in Western Queensland offered year 10 school leavers up to $100,000 as apprentice starting wages.
In Roma, Queensland, small businesses struggled to retain staff, with one pizza shop experiencing turnover of almost 100 staff in just 18 months. This dramatic example illustrates how geographic isolation and competition for workers can drive significant wage differentials even for similar roles.
Productivity: Under enterprise bargaining arrangements, employees can negotiate higher wages at the individual firm level in exchange for taking steps to increase their productivity. Workers who contribute more output per hour can command higher pay.
Capacity of the firm to pay: Some firms are more profitable than others and have greater capacity to pay higher wages. Firms with market power—the ability to set prices and earn higher profits—can afford to pay more than firms facing intense competition.
Age and wage outcomes
Income varies significantly over the course of a person's working life, generally remaining highest during the core working years between ages 25 and 64.
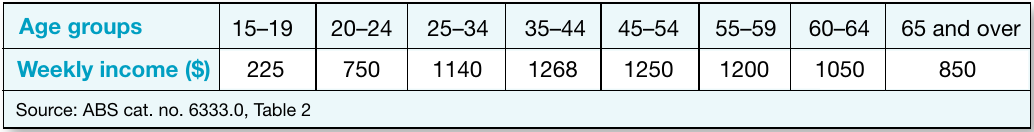
The table above reveals important age-related patterns:
- The 35-44 age group earns the highest median weekly income ($1,268)
- The 15-19 age group earns the lowest ($225), as these workers typically have minimal education and experience
- The 20-24 age group earns $750 per week, reflecting some experience but still relatively limited skills
- Income gradually declines after age 55, falling to $850 per week for those aged 65 and over
For full-time workers specifically, there is less variation, and interestingly, the highest-earning full-time workers are those over 65. This reflects the fact that among those working full-time at this age, there are proportionally more highly skilled and fewer low-skilled workers remaining in the workforce.
These patterns show that income levels are lower in the early years of working life when people have less education and experience. Similarly, income levels decline as people transition to retirement and rely on age pensions or other retirement income sources.
Gender and the pay gap
Despite Australia's employment laws recognising the principle of equal pay for equal work since 1969, significant gender-based wage differentials persist. A second principle, equal pay for work of equal value, emerged to address the fact that many women reduce paid work hours to fulfil unpaid caring roles, particularly child-rearing.
However, evidence suggests that discrimination still exists, particularly regarding access to the highest-paid positions. Women are said to face a "glass ceiling" in employment—an invisible barrier that makes it harder to reach top-paying positions.
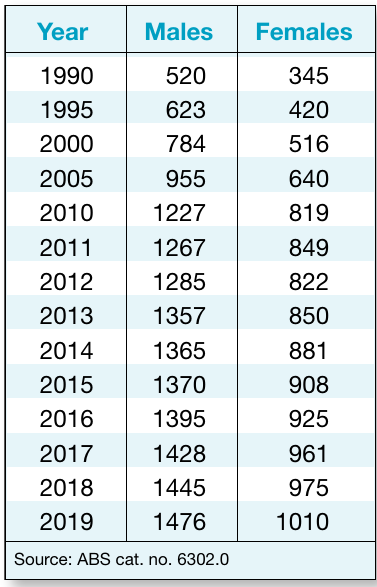
The table above shows the substantial difference in average weekly total earnings between males and females from 1990 to 2019. In 2019, women's average weekly earnings ($1,010) were only about two-thirds of men's earnings ($1,476). Moreover, wage relativities have barely changed over the past two decades.
Causes of the gender pay gap
Part of the difference can be explained by human capital factors—historically, women had fewer opportunities to acquire education, skills, and qualifications due to societal attitudes about women's roles. However, even accounting for these differences, women earn less than men in many similar jobs. A 2016 Australian National University analysis found that men earn on average 19% more than women working full-time in the same occupations, suggesting direct discrimination.
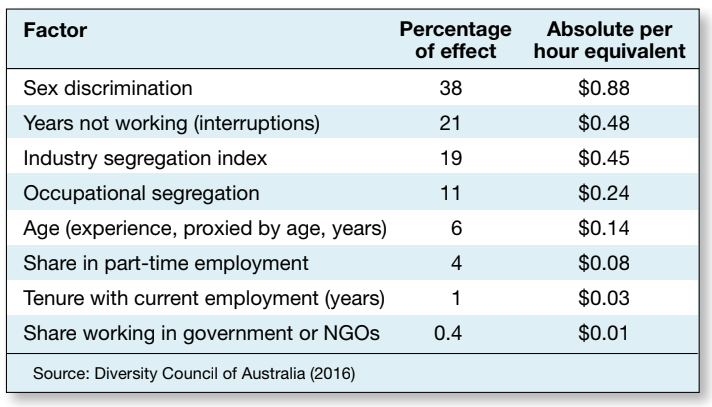
The 2016 Diversity Council of Australia report She's Priceless: The Economics of the Gender Pay Gap quantified the various contributing factors. Women are on average paid $2.32 less per hour than men. The three largest contributing factors are:
- Sex discrimination (38% of the gap, or $0.88 per hour): Direct discriminatory practices in hiring, promotion, and pay decisions
- Years not working/career interruptions (21% of the gap, or $0.48 per hour): Typically caused by taking time off to care for children, which impacts career progression and earning potential
- Industry segregation (19% of the gap, or $0.45 per hour): Women are disproportionately employed in lower-paid industries
Other factors include occupational segregation (11%), age and experience (6%), part-time employment share (4%), tenure with current employer (1%), and working in government or NGOs (0.4%).
Migrant status and cultural background
Almost 3 in every 10 Australian workers were born overseas (3.4 million out of 11.6 million workers in 2015), with 1.2 million having migrated within the previous decade.
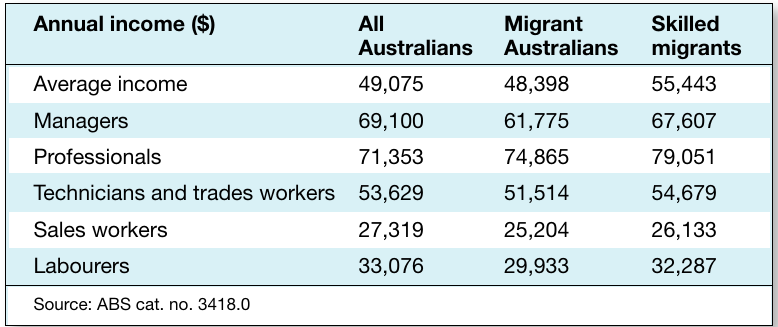
The Australian Bureau of Statistics data reveals important patterns:
- Overall migrant workers earn an average of $48,398 annually, slightly less than the average taxpayer ($49,075)
- Skilled migrants earn significantly more—$55,443 on average—well above the national average. This reflects that skilled migrants have higher skill levels than the average Australian workforce, as they are specifically recruited for their qualifications
- By occupation: In high-paying categories like managers and professionals, migrant workers earn more than average taxpayers. For example, migrant professionals earn $74,865 compared to the overall average of $71,353. However, in lower-paying occupations like labourers and sales workers, Australian-born workers earn more
- Recency of migration: Workers who have most recently migrated tend to have lower incomes initially, but these rise relatively quickly towards average levels
Language Proficiency and Migrant Earnings
A 2014 Monash University study found that while migrants earn higher incomes overall, they receive lower rewards for their education than Australian-born workers. This appears to be explained by weaker English language proficiency rather than discrimination.
Previous research found that migrants from English-speaking backgrounds earn about 10% more than those from non-English-speaking backgrounds, reflecting the importance of language proficiency in accessing better-paid jobs.
Overall, Australian research suggests that wage outcomes for migrants slowly conform to the average for all Australians. Where worse outcomes occur, they are more likely due to language proficiency or skills gaps than discrimination. This distinguishes Australia from countries like the United States and several European economies, where migrants experience more sustained wage disadvantage.
Indigenous Australians
Indigenous Australians (Aboriginal and Torres Strait Islander peoples) represent around 3% of Australia's population but experience high levels of labour market disadvantage. According to 2016 census data:
- Mean weekly personal income for Indigenous Australians was only 71% of income for the overall population ($622 per week compared to $876)
- Mean weekly household income was $1,505, or 80% of the mean for Australian households generally
- Only 20% of Indigenous Australians earned household income exceeding $1,000 per week, compared to 34% of the general population
- Approximately 43% of Indigenous people were in the lowest income quintile (the bottom 20% of income earners), while just 6% were in the highest income quintile
This represents significant and persistent disadvantage that cannot be explained by recent migration or language barriers, pointing to deeper structural issues including historical discrimination, lower access to education, and geographic isolation.
Remember!
Key Points to Remember:
-
Nominal wages are money wages not adjusted for inflation, while real wages measure actual purchasing power after adjusting for inflation—real wages tell us if workers are genuinely better off
-
Wage differentials between occupations reflect differences in skills required, education length, working conditions, and occupational mobility—managers earn the highest wages while sales workers earn the lowest
-
The relationship between wages, productivity, and inflation determines real labour costs—when real wage growth exceeds productivity growth, labour costs rise and employment may fall
-
Despite equal pay laws since 1969, women earn only about two-thirds of men's earnings, with discrimination (38%), career interruptions (21%), and industry segregation (19%) being the main factors
-
Skilled migrants earn above-average incomes ($55,443 vs $49,075 nationally), but language proficiency affects outcomes for non-English speaking migrants—Indigenous Australians experience significant disadvantage with incomes at only 71% of the national average