Demand (HSC SSCE Economics): Revision Notes
Price Elasticity of Demand
What is price elasticity of demand?
Price elasticity of demand (PED) measures how responsive consumers are when the price of a product changes. Specifically, it shows the percentage change in quantity demanded following a one per cent change in price.
Understanding this concept helps answer a crucial question: when prices change, how much does the quantity demanded change? The answer varies significantly between different products and situations.
Types of elasticity
There are three main categories of price elasticity, each describing a different level of consumer responsiveness to price changes.
Elastic demand occurs when consumers show a strong response to price changes. The percentage change in quantity demanded is greater than the percentage change in price. For example, if a restaurant increases its prices by 10%, and demand falls by 20%, this demonstrates elastic demand.
Inelastic demand occurs when consumers show a weak response to price changes. The percentage change in quantity demanded is smaller than the percentage change in price. For instance, if petrol prices increase by 10% but consumption only falls by 3%, demand is inelastic.
Unit elastic demand represents the middle ground, where the percentage change in quantity demanded exactly matches the percentage change in price. This means total consumer spending remains constant despite the price change.
The key distinction between these three types lies in comparing the relative sizes of the percentage changes in price and quantity demanded. Elastic means quantity changes more, inelastic means quantity changes less, and unit elastic means they change by the same proportion.
Why price elasticity matters
For businesses
Understanding PED is essential for developing effective pricing strategies. When demand is elastic, lowering prices leads to a proportionally larger increase in sales volume, which boosts total revenue. Conversely, when demand is inelastic, businesses can increase prices without losing many customers, again increasing total revenue.
Firms often invest in market research to determine the price elasticity of their products at different price points. This knowledge guides decisions about pricing adjustments and helps predict how competitors' price changes might affect their own sales.
The relationship between elasticity and revenue is crucial for business decision-making. A business with elastic demand should consider price reductions to increase revenue, while a business with inelastic demand can raise prices to increase revenue.
For government
Governments need to understand PED for two key purposes. First, when setting prices for public services like transport or utilities, they must predict how demand will respond to fare changes. Second, when imposing indirect taxes (such as excise duties on alcohol, tobacco, or fuel), they need to estimate the revenue these taxes will generate.
Governments typically target goods with inelastic demand for excise taxation. Why? Because consumers continue purchasing these products even when prices rise, ensuring stable tax revenue. If an excise tax were placed on a product with elastic demand, the resulting price increase would cause a sharp drop in sales, reducing the expected tax revenue.
Measuring price elasticity: the total outlay method
The total outlay method provides a straightforward way to determine whether demand is elastic, inelastic, or unit elastic. This method examines what happens to total revenue (also called total outlay or total expenditure) when prices change.
Total outlay is calculated as:
The relationship between price changes and total outlay reveals the type of elasticity:
Key Relationship:
- If price and total outlay move in the same direction → demand is inelastic
- If price and total outlay move in opposite directions → demand is elastic
- If total outlay remains unchanged → demand is unit elastic
Working through examples
The following table demonstrates how to apply the total outlay method across different price ranges:
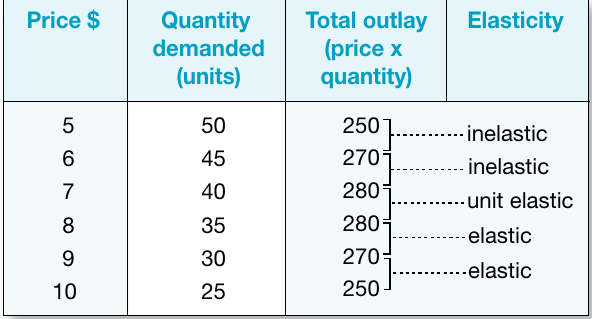
Worked Example 1: Inelastic Demand
Starting at $5 per unit with 50 units demanded:
- Total outlay = $5 × 50 = $250
- Price rises to $6, quantity demanded falls to 45 units
- New total outlay = $6 × 45 = $270
Conclusion: Total outlay increased from $250 to $270, moving in the same direction as the price. This indicates inelastic demand over this price range.
Worked Example 2: Elastic Demand
Starting at $8 per unit with 35 units demanded:
- Total outlay = $8 × 35 = $280
- Price rises to $9, quantity demanded falls to 30 units
- New total outlay = $9 × 30 = $270
Conclusion: Total outlay decreased from $280 to $270, moving in the opposite direction to the price. This indicates elastic demand over this price range.
Worked Example 3: Unit Elastic Demand
Starting at $7 per unit with 40 units demanded:
- Total outlay = $7 × 40 = $280
- Price rises to $8, quantity demanded falls to 35 units
- New total outlay = $8 × 35 = $280
Conclusion: Total outlay remained unchanged at $280. This indicates unit elastic demand over this price range.
Understanding demand curves and elasticity
Why slope doesn't tell the whole story
Common Misconception: Many students believe that the slope of a demand curve determines its elasticity. However, even a straight-line demand curve (which has a constant slope) exhibits different elasticities at different points along the curve.
At high prices (upper part of the curve), demand tends to be elastic because consumers are more sensitive to price changes. At low prices (lower part of the curve), demand tends to be inelastic because the absolute price changes become less significant to consumers.
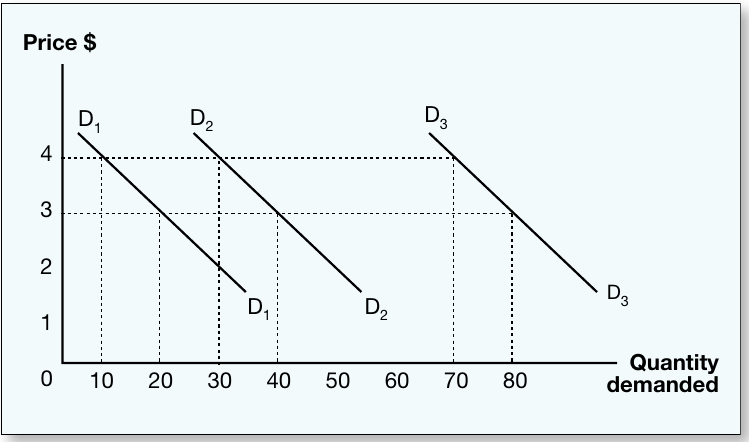
The diagram above shows three demand curves with identical slopes but positioned at different distances from the origin. Applying the total outlay method to a price change from $4 to $3 reveals:
- On curve : Total outlay rises from $40 to $60 → demand is elastic
- On curve : Total outlay remains at $120 → demand is unit elastic
- On curve : Total outlay falls from $280 to $240 → demand is inelastic
This demonstrates that identical slopes can produce different elasticities depending on the price-quantity combination.
Extreme cases of elasticity
Two theoretical extremes of elasticity help illustrate the boundaries of consumer responsiveness. While rarely observed in perfect form across entire markets, understanding these cases clarifies the concept of elasticity.
Perfectly elastic demand
Perfectly elastic demand occurs when consumers will purchase unlimited quantities at a specific price, but nothing at any higher price. The demand curve appears as a horizontal line.
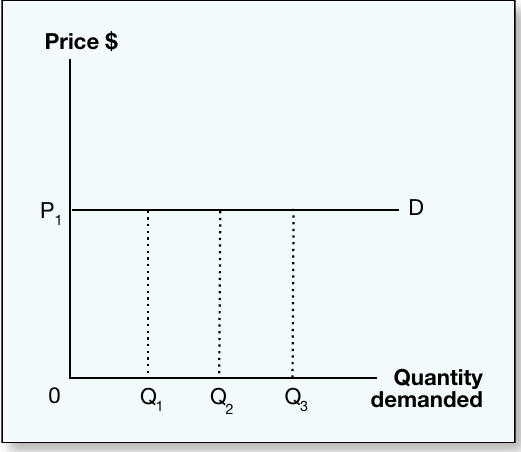
In reality, individual sellers in highly competitive markets face demand curves that approximate perfect elasticity. Consider an apple grower selling at a farmers' market alongside many other growers selling identical apples. If this grower charges even slightly more than the market price, customers will buy from competitors instead. The grower can sell their entire stock at the market price, but nothing above it. From the individual seller's perspective, demand is perfectly elastic at the market price.
Perfectly inelastic demand
Perfectly inelastic demand occurs when consumers purchase the same quantity regardless of price. The demand curve appears as a vertical line.
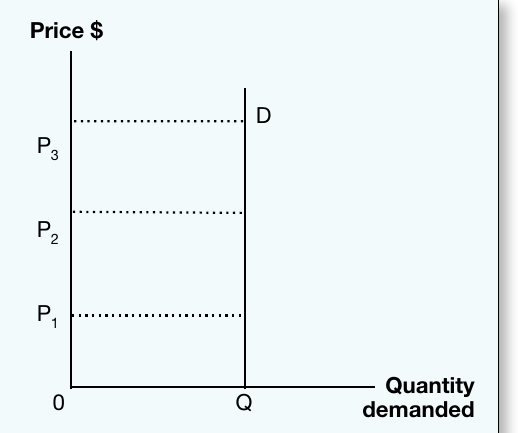
This situation is rare but can apply to essential, life-saving products with no substitutes. For instance, someone with a life-threatening condition requiring a specific medication might purchase it at almost any price. This potential for exploitation explains why governments often regulate markets for essential medicines and medical treatments.
Factors determining elasticity of demand
Five key factors influence how elastic or inelastic demand will be for any particular product. Understanding these factors helps predict consumer behaviour and design appropriate pricing strategies.
Necessities versus luxuries
Products considered essential for daily life exhibit inelastic demand. Even when prices rise, consumers continue purchasing necessities like bread, milk, or basic utilities because they have limited alternatives. The quantity demanded doesn't fall significantly.
Luxury goods and services show more elastic demand. Items like fine dining, designer clothing, or holiday travel are discretionary purchases. When prices increase, consumers can simply choose not to buy these items or postpone purchases, causing a larger proportional decrease in quantity demanded.
Availability of substitutes
The existence of close substitutes is perhaps the most important determinant of elasticity. Products with many substitutes have highly elastic demand because consumers can easily switch to alternatives when prices rise.
For example, different brands of breakfast cereal are close substitutes for each other. If one brand's price increases by 10%, many consumers will simply switch to another brand, causing a more than proportional decrease in quantity demanded for the expensive brand.
Conversely, products with few or no substitutes have inelastic demand. The local water supply has no real substitute—if prices increase, consumers have limited options and must continue purchasing roughly the same amount. Quantity demanded falls only slightly.
Proportion of income spent
When a product represents only a tiny fraction of total income, demand tends to be inelastic. Most consumers won't refuse to buy chewing gum or disposable pens because of a 10% price increase—the absolute cost difference is too small to matter.
However, major purchases that consume a significant portion of income show more elastic demand. A 10% increase in car prices or housing costs might cause many consumers to delay purchases, seek alternatives, or choose cheaper models. The larger the proportion of income involved, the more carefully consumers evaluate price changes.
Time elapsed since the price change
Elasticity tends to increase over time as consumers have more opportunity to adjust their behaviour. Immediately after a price increase, quantity demanded may not change much because consumers need time to:
- Become aware of the price change
- Research and identify alternatives
- Change consumption habits
- Make practical adjustments
Worked Example: Petrol Price Changes Over Time
When petrol prices rise sharply, consumption initially falls only slightly (inelastic). Over time, however, consumers might:
- Buy more fuel-efficient vehicles
- Use public transport more frequently
- Relocate closer to work
- Form carpools with colleagues
Result: Demand becomes more elastic as these adjustments occur.
The durability of goods also affects how elasticity changes over time. For durable goods like cars or appliances, an initial price rise causes very elastic demand as consumers postpone replacement and repair existing items instead. However, this elasticity eventually decreases as old items must eventually be replaced regardless of price.
Habit-forming characteristics
Products that are addictive or habit-forming typically exhibit inelastic demand. Consumers of tobacco and alcohol tend to maintain consumption levels even when prices increase substantially. The psychological and physical dependence reduces their responsiveness to price changes.
This characteristic partly explains why governments often impose heavy taxes on cigarettes and alcohol—they know demand will remain relatively stable despite the price increases, ensuring consistent tax revenue.
Key Concepts to Remember:
Core Definitions:
- Price elasticity of demand measures consumer responsiveness to price changes
- Elastic demand: quantity changes more than proportionally to price (opposite direction to revenue)
- Inelastic demand: quantity changes less than proportionally to price (same direction as revenue)
- Unit elastic: quantity changes proportionally to price (revenue unchanged)
The Total Outlay Method:
- When price and total revenue move in the same direction → demand is inelastic
- When price and total revenue move in opposite directions → demand is elastic
- When total revenue remains unchanged → demand is unit elastic
Factors Making Demand More Elastic:
- Product is a luxury rather than necessity
- Many close substitutes available
- Product represents large proportion of income
- More time has passed since price change
- Product is not habit-forming
Factors Making Demand More Inelastic:
- Product is a necessity
- Few or no substitutes available
- Product represents small proportion of income
- Little time since price change
- Product is habit-forming or addictive
For Exam Success: Always explain the relationship between price changes, quantity demanded changes, and total revenue when analysing elasticity. Use real-world examples to support your analysis.