Differences in Income and Economic Growth (HSC SSCE Economics): Revision Notes
Differences in Income and Economic Growth
Introduction to measuring income
Income serves as the most widely used indicator for comparing living standards across different economies worldwide. It reflects the capacity of a nation's citizens to meet their material needs and wants. While income measurements have limitations, they provide a standardised way to assess and compare economic wellbeing between countries.
The global economy exhibits substantial disparities in income levels. Understanding these differences requires careful analysis of how income is measured and compared across nations with varying economic structures, population sizes, and price levels.
While income is the primary measure for comparing economies, it has important limitations. It doesn't capture non-monetary aspects of wellbeing like environmental quality, leisure time, or social cohesion. It also doesn't reveal how income is distributed within a country - a nation might have high average income but severe internal inequality.
Gross National Income (GNI)
Gross National Income (GNI) represents the total income earned by a country's residents from both domestic production and overseas sources. It includes all value generated by resident producers within an economy, plus any primary income received from foreign investments or work abroad.
Real GNI adjusts nominal GNI figures to account for inflation. This adjustment is essential because it allows for meaningful comparisons of income changes over time, removing the distorting effects of rising prices. Economists use real GNI to track genuine improvements in a nation's productive capacity and income generation.
Key Distinction: GNI differs from GDP because it includes income earned abroad by residents while excluding income earned domestically by non-residents. For example, if a British company earns profits from operations in France, this counts toward Britain's GNI but France's GDP.
Comparing economies by size
When examining the world's largest economies, significant disparities become apparent. The United States maintains its position as the world's largest economy by a considerable margin.
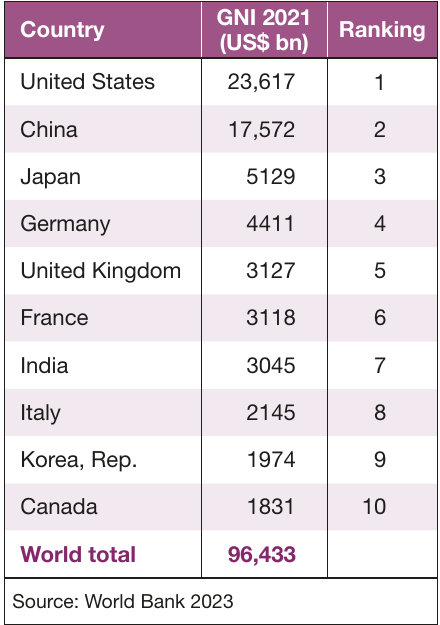
The data reveals that the US economy generates approximately one-third more income than China, the second-largest economy, and nearly five times the output of Japan in third place. This concentration of economic power in a small number of nations reflects historical patterns of industrialisation, technological development, and capital accumulation.
The top ten economies account for the vast majority of global output, demonstrating how economic power is concentrated in relatively few countries. This concentration has important implications for global governance, trade patterns, and development assistance.
Limitations of exchange rate comparisons
A critical challenge in comparing economies arises from exchange rate distortions. When all income figures are converted to US dollars for comparison purposes, this can create misleading impressions about living standards, particularly in developing countries.
The problem stems from the fact that goods and services in developing nations often cost substantially less than equivalent items in the United States. If prices are lower in developing countries relative to US prices, then converting their GNI into US dollars underestimates the true purchasing power and living standards of people in those countries.
Real-World Comparison: The Haircut Example
Consider the cost of a simple haircut:
- New York, USA: $50
- Mumbai, India: $5
Using the exchange rate alone, we might conclude that someone earning $500 in India is 10 times poorer than someone earning $500 in the US. However, if many goods and services (like haircuts, food, housing) cost one-tenth as much in India, then $500 buys similar amounts of goods and services in both countries.
This demonstrates why exchange rate comparisons can be misleading without adjusting for price differences.
Common Misconception: Many people assume exchange rates accurately reflect the relative value of currencies. In reality, exchange rates are influenced by capital flows, speculation, trade balances, and government policies - factors that have little to do with the actual purchasing power of everyday goods and services within each country.
Purchasing Power Parity (PPP)
To address exchange rate limitations, economists use Purchasing Power Parity (PPP) adjustments. PPP is an economic concept that adjusts measurements to reflect the actual purchasing power of currencies within their home economies, rather than relying solely on market exchange rates.
PPP adjustments work by comparing the cost of a standardised basket of goods and services across different countries. This provides a more accurate comparison of real income levels and living standards. Countries with undervalued exchange rates (typically developing nations) see their comparative income figures rise substantially when PPP adjustments are applied.
The adjustment is crucial because exchange rates are influenced by many factors beyond the relative prices of goods - including capital flows, speculation, and government policies. PPP focuses specifically on what money can actually buy within each economy.
The "Big Mac Index," created by The Economist magazine, provides a simplified illustration of PPP. By comparing the price of a McDonald's Big Mac across countries, it shows how exchange rates may over- or under-value currencies compared to their domestic purchasing power.
Income distribution by country groupings
The World Bank classifies countries into four income categories: low income, lower middle income, upper middle income, and high income. This classification helps identify patterns of global inequality and target development assistance.
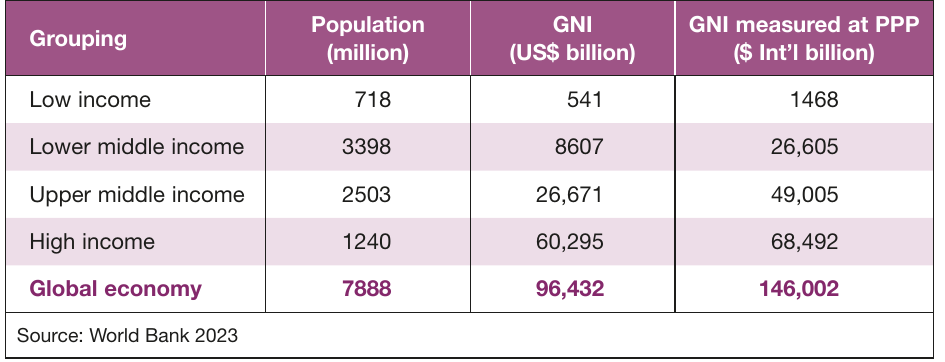
The data demonstrates stark inequalities in the global economy:
High-income economies capture approximately two-thirds of global income (as measured by raw GNI) and nearly half when using PPP adjustments. Yet these wealthy nations represent only 1.2 billion people out of a global population of approximately 8 billion - roughly 15 per cent.
Low-income economies account for 9 per cent of the world's population (718 million people) but generate less than 1 per cent of global income. Even after PPP adjustments, which nearly triple their comparative income figures, these countries remain desperately poor.
The PPP-adjusted figures substantially improve the relative position of low and middle-income countries. For example, the combined GNI of lower middle-income countries increases from $8,607 billion to $26,605 billion when measured at PPP. This reflects the undervaluation of their currencies and lower domestic price levels.
Critical Inequality Pattern: Despite PPP adjustments improving the relative position of developing countries by 2-3 times, massive inequalities persist. High-income countries capture income vastly disproportionate to their population share, revealing fundamental structural imbalances in the global economy.
The concentration becomes even starker when considering that high-income countries represent just 15% of world population but control approximately two-thirds of global income at market exchange rates. This is not simply a matter of productivity differences - it reflects historical advantages, institutional strengths, and structural features of the global economy.
GNI per capita comparisons
Population size varies enormously between countries and significantly affects overall income figures. To make meaningful comparisons of living standards, economists calculate GNI per capita by dividing total GNI by population. This reveals the average income per person.
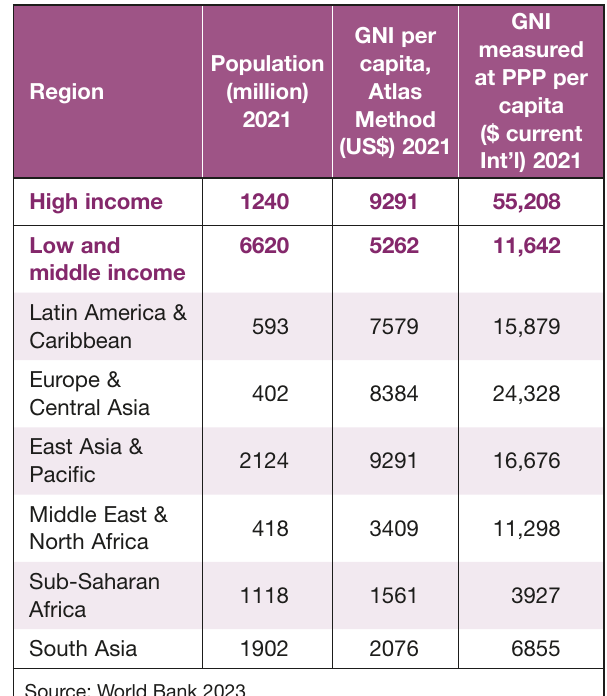
Regional analysis using GNI per capita (PPP) exposes the depth of global inequality:
High-income regions enjoy average incomes of $55,208 per capita at PPP, nearly five times higher than the $11,642 average in low and middle-income countries. This represents an enormous gap in material living standards.
Sub-Saharan Africa and South Asia, home to nearly 40 per cent of the world's population (over 3 billion people), experience exceptionally low living standards:
- Sub-Saharan Africa: $3,927 per capita (PPP)
- South Asia: $6,855 per capita (PPP)
These figures are roughly 7-14 times lower than high-income regions, indicating severe deprivation and limited economic opportunities for billions of people.
Regional Disparities - The Scale of the Gap:
The income gap between high-income regions and Sub-Saharan Africa is staggering:
- High-income: $55,208 per capita
- Sub-Saharan Africa: $3,927 per capita
- Ratio: 14:1
This means the average person in a high-income country has 14 times more purchasing power than someone in Sub-Saharan Africa, even after adjusting for lower prices in Africa. With nearly 40% of humanity living in these poorest regions, this represents one of the most significant challenges facing the global economy.
Regional disparities reflect historical patterns of colonisation, differences in natural resource endowments, variations in governance quality, and unequal access to technology and capital. Europe & Central Asia ($24,328) and East Asia & Pacific ($16,676) show middle-income characteristics, while Latin America & Caribbean ($15,879) demonstrates moderate development levels.
Progress in reducing extreme poverty
Despite persistent inequalities, the global economy has achieved remarkable progress in reducing extreme poverty over recent decades. Extreme poverty is defined as living on less than US$2.15 per day (2017 PPP).
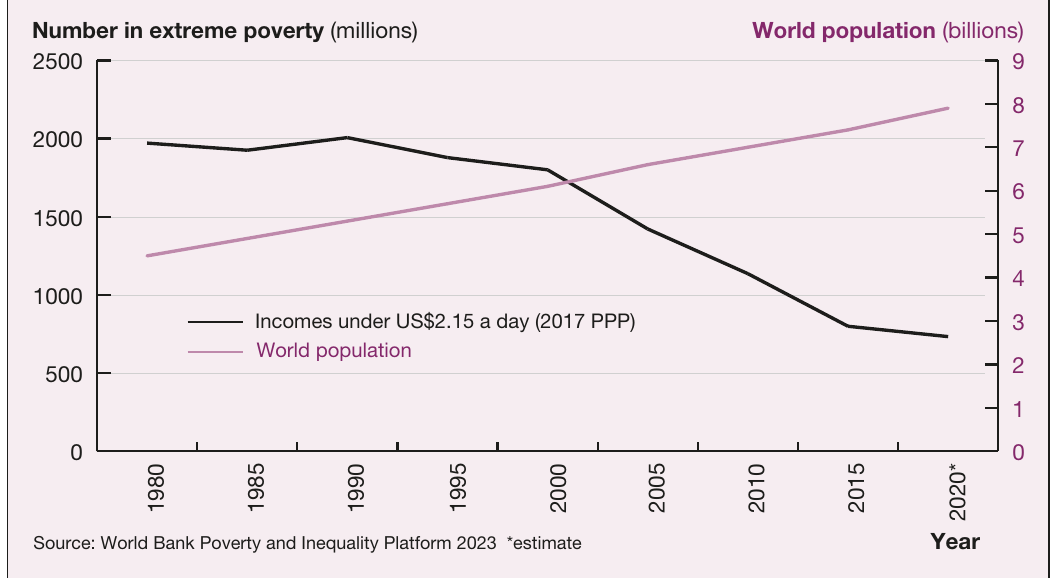
The graph reveals a striking contradiction: while world population has nearly doubled from approximately 4.5 billion in 1980 to nearly 8 billion by 2020, the number of people living in extreme poverty has declined dramatically from around 2 billion to approximately 750 million.
This represents a fall from 43.6 per cent of the global population in extreme poverty (1981) to just 9 per cent (2019). The lines cross around the year 2000, marking a historic turning point when poverty reduction accelerated even as population continued growing.
This progress reflects several factors:
- Rapid economic growth in China and other Asian economies
- Improvements in agricultural productivity
- Expansion of global trade and investment
- Advances in healthcare and education
- Technological innovations spreading to developing countries
Challenges Remain Despite Progress:
While the overall trend is positive, significant challenges persist:
- Around 685 million people still lived in extreme poverty in 2022
- Two-thirds of those in extreme poverty are concentrated in Sub-Saharan Africa
- The COVID-19 pandemic pushed an estimated 80 million people back into poverty
- Progress has been uneven across regions, with some areas seeing minimal improvement
This highlights the fragility of poverty reduction gains and the vulnerability of those living just above the poverty line.
Wealth distribution
While income measures the flow of money people receive, wealth represents the stock of assets (property, savings, investments) minus liabilities (debts). Wealth provides security, can generate income, and enables investment in education and opportunities.
Global wealth exhibits even more extreme concentration than income:
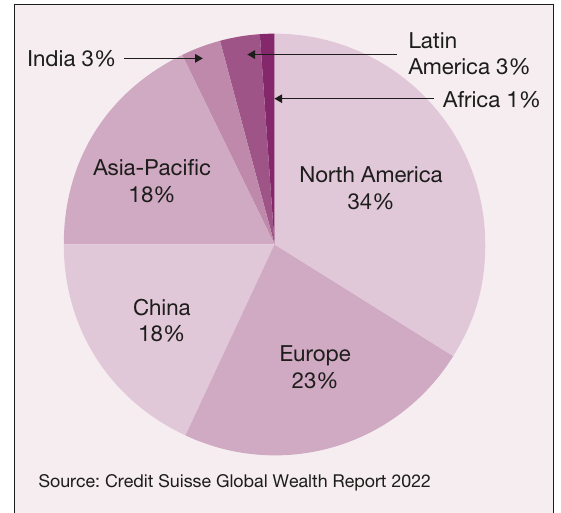
Regional distribution shows North America controls 34 per cent of global wealth, followed by Europe (23 per cent), with China and Asia-Pacific each holding 18 per cent. In stark contrast, Sub-Saharan Africa possesses just 1 per cent of global wealth despite having 14 per cent of world population.
Personal distribution reveals shocking inequality. According to Credit Suisse research:
- The top 1 per cent of individuals own 46 per cent of global wealth
- The bottom 50 per cent own less than 1 per cent
This concentration has intensified. During the COVID-19 pandemic, the richest 1 per cent gained twice as much wealth as the other 99 per cent combined. The number of billionaires worldwide has doubled in the past decade.
Wealth vs Income Inequality:
Wealth is distributed far more unequally than income. While income inequality is severe (high-income countries get two-thirds of global income), wealth inequality is extreme:
- Top 1%: 46% of global wealth
- Bottom 50%: <1% of global wealth
This matters because wealth:
- Provides economic security that income alone cannot
- Generates additional income through investments
- Can be passed down across generations
- Translates into political power and influence
Wealth concentration persists across generations, particularly in countries without inheritance taxes. Approximately half of all billionaires reside in nations that don't tax inherited wealth, allowing dynastic accumulation to continue indefinitely.
This extreme wealth inequality matters because it:
- Limits economic opportunities for the majority
- Concentrates political power and influence
- Reduces social mobility
- Can undermine democratic institutions
- Creates social instability and resentment
Exam guidance
When analysing global income inequality for assessment:
For "explain" questions: Focus on the mechanisms - clearly define GNI, explain why PPP adjustments are necessary, and describe how per capita calculations account for population differences.
For "analyse" questions: Use data from the tables and graphs to identify patterns and trends. Compare different regions or time periods. Calculate percentage changes or ratios to quantify disparities.
For "evaluate" or "assess" questions: Consider both improvements (declining extreme poverty) and persistent problems (wealth concentration). Evaluate whether current trends are sustainable. Consider what the data reveals about the effectiveness of globalisation in reducing inequality.
Using Data Effectively in Exams:
Always support arguments with specific statistics from the data provided. For example:
- Don't just say "inequality is high" - state that "high-income countries capture two-thirds of global income despite representing only 15% of population"
- Use ratios to show scale: "Sub-Saharan Africa's GNI per capita is 14 times lower than high-income regions"
- Reference trends: "Extreme poverty fell from 43.6% to 9% between 1981 and 2019"
Consider both absolute measures (total GNI) and relative measures (per capita, percentages) to provide comprehensive analysis.
Key Points to Remember:
-
GNI measures total income earned by a country's residents from domestic and foreign sources, while real GNI adjusts for inflation to enable accurate comparisons over time
-
PPP adjustments are essential because exchange rates distort comparisons - they account for price differences between countries and typically increase the relative income of developing economies by 2-3 times
-
High-income countries (15% of population) capture approximately two-thirds of global income, while low-income countries (9% of population) generate less than 1% - revealing massive structural inequality
-
GNI per capita provides the most accurate comparison of living standards by accounting for population size - Sub-Saharan Africa ($3,927 PPP) and South Asia ($6,855 PPP) have exceptionally low levels, approximately 7-14 times below high-income regions
-
Extreme poverty has declined dramatically from 43.6% (1981) to 9% (2019) despite population doubling, but wealth inequality has intensified - the top 1% own 46% of global wealth while the bottom 50% own less than 1%