Globalisation (HSC SSCE Economics): Revision Notes
Globalisation
What is globalisation?
Globalisation refers to the increasing integration and interdependence of national economies around the world. This process involves the movement of goods, services, capital, technology, and people across international borders, creating stronger economic linkages between countries.
The globalisation era has transformed the world economy, though recent years have seen challenges. The COVID-19 pandemic disrupted global supply chains and international travel, leading some economists to describe the past decade as "slowbalisation" due to slower trade growth, increased trade restrictions, and rising geopolitical tensions.
Key indicators of globalisation
From an economic perspective, five main indicators demonstrate the integration between economies:
The five key indicators of economic globalisation provide a comprehensive framework for understanding how economies are interconnected:
- International trade in goods and services
- International financial flows
- International investment flows and transnational corporations
- Technology, transport and communication
- The movement of workers between countries
These indicators provide insight into how economies are linked and continuously reshaping the global economy.
Trade in goods and services
Understanding trade as a globalisation indicator
International trade measures how goods and services produced in one economy are consumed in other economies worldwide. It serves as a crucial indicator of globalisation because it demonstrates economic interdependence.
Gross World Product (GWP) is the sum of total output of goods and services by all economies in the world over a period of time.
Growth in global trade
The value of exports has grown dramatically:
- 1990: US$4.3 trillion (19% of global output)
- 2022: US$27.9 trillion (29% of global output)
The GWP is now 9 times its 1980 nominal level, whilst world trade has grown to over 12 times its 1980 level. This shows trade has grown faster than overall economic output, demonstrating the increasing importance of international exchange in the global economy.
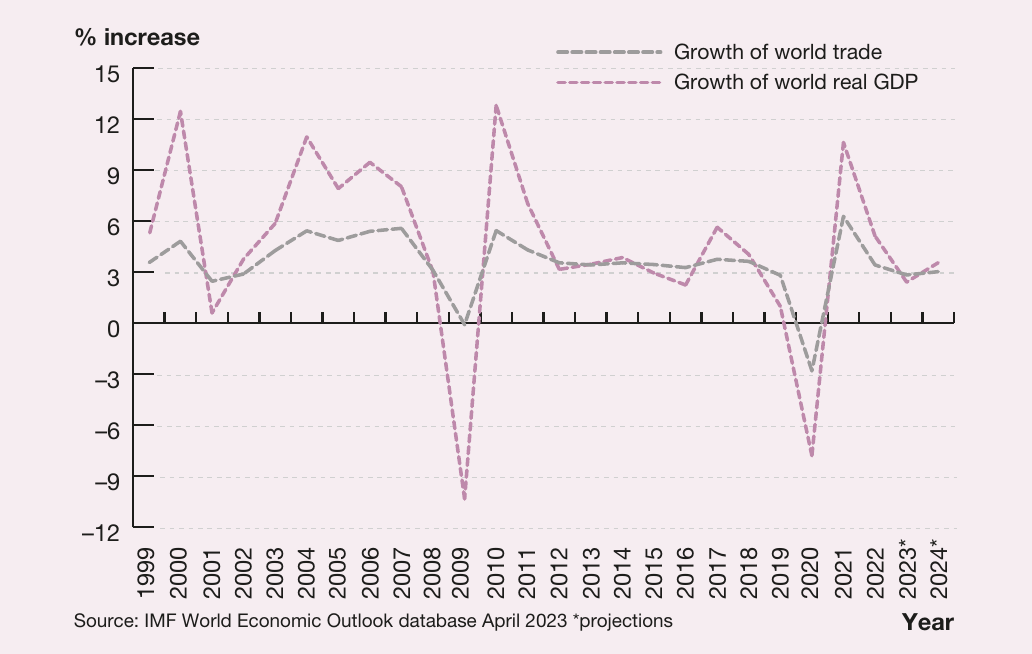
Trade growth generally tracks global economic growth, but exhibits greater volatility. During economic downturns (early 2000s, late 2000s, and 2020), trade contracts faster than overall economic output. The COVID-19 pandemic caused a 7.8% contraction in global trade in 2020, followed by a strong recovery in 2021.
Drivers of trade growth
Several factors have enabled the expansion of global trade:
- Technological advances in transport and communications reduced the cost of moving goods between economies
- Government policies removing trade barriers
- International cooperation through organisations like the World Trade Organization (WTO) – an organisation of 164 member countries that implements global trade agreements and resolves trade disputes
Regional trade groups such as the European Union (EU) and the Association of South-East Asian Nations (ASEAN) have also facilitated increased trade flows.
Composition of trade
The composition of trade refers to the mix of goods and services being traded internationally.
Key features of global trade composition:
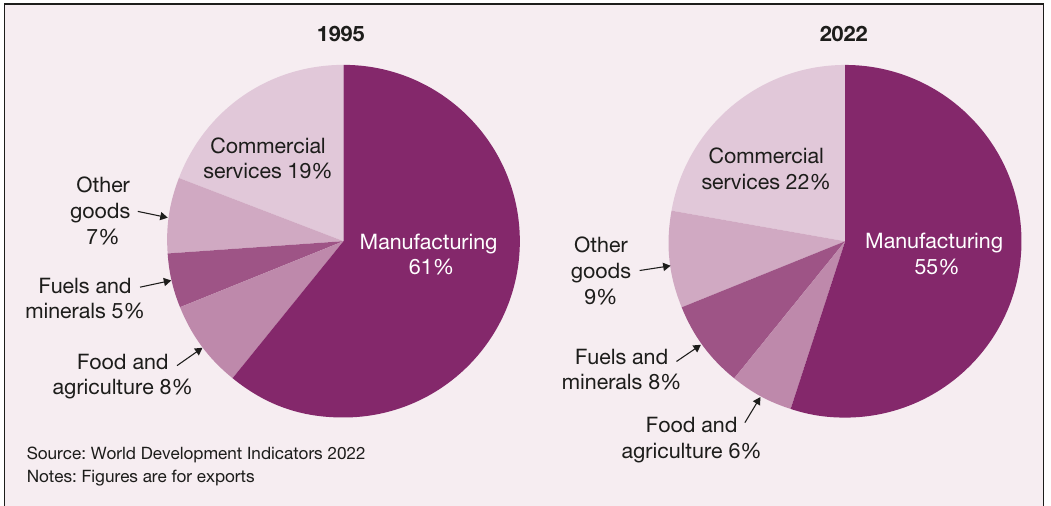
- Manufacturing dominates global trade, though its share has declined from 61% (1995) to 55% (2022)
- Commercial services represent the fastest-growing category, increasing from 19% to 22% of trade
- Services comprise two-thirds of global output but less than one-quarter of exports
- Digital service exports have tripled in value since 2005
Countries with highly educated workforces, like Australia, are well-positioned to benefit from growth in services trade. However, the COVID-19 pandemic temporarily disrupted services sectors such as tourism and international education due to travel restrictions.
Direction of trade
The direction of trade refers to which regions and countries are the main sources and destinations of trade flows.
Significant shifts have occurred:
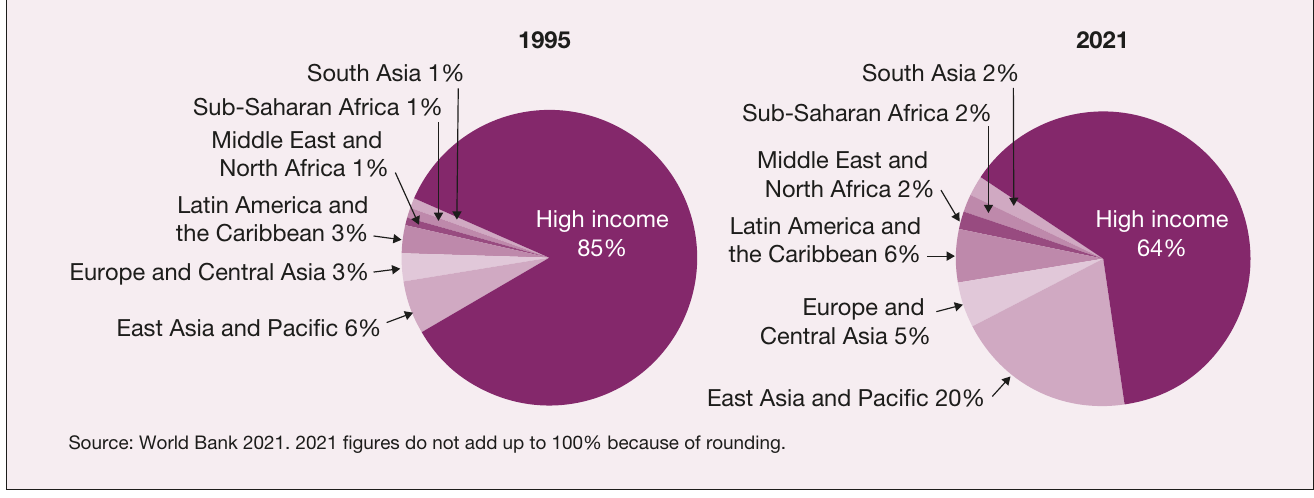
High-income economies (North America and Western Europe):
- 1995: 85% of global exports
- 2021: 64% of global exports
East Asia and Pacific (including China, Indonesia, Vietnam):
- 1995: 6% of global exports
- 2021: 20% of global exports
These changes reflect the growing economic importance of developing regions, particularly East Asia. For individual economies like Australia, this shift has implications for trade policy, such as encouraging Mandarin language education and diversifying trade relationships beyond China to include India and other regional partners.
Financial flows
The globalisation of finance
International finance plays a leading role in the global economy. Finance is the most globalised sector because money moves between countries more quickly than goods, services, or people.
Growth of financial flows
Financial flows expanded substantially following financial deregulation in the 1970s and 1980s, when countries removed controls on:
- Foreign currency markets
- Flows of foreign capital
- Banking interest rates
- Overseas investments in share markets
Technological change enabled this expansion through secure, high-speed networks linking financial markets worldwide. Events in major international markets (New York, Tokyo, London, Hong Kong) can now produce immediate results globally.
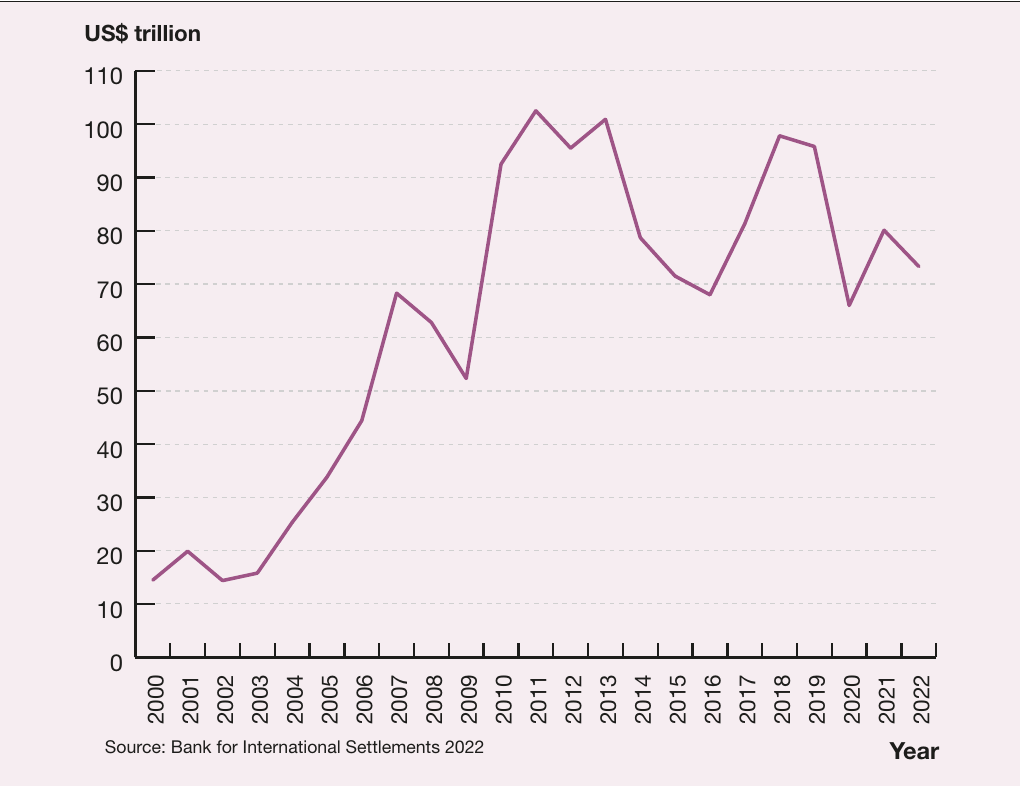
Financial flows fluctuate significantly in response to global conditions, with sharp falls followed by recoveries during major economic crises:
- 2008: Global financial crisis
- 2013: Eurozone crisis
- 2020: COVID-19 pandemic
Foreign exchange markets
Foreign exchange markets (forex markets) are networks of buyers and sellers exchanging currencies to facilitate financial flows between countries.
Key statistics:
- Average daily turnover: US$7.5 trillion (2022)
- Up from US$4 trillion (2010)
The exchange rate expresses the value of one currency in terms of another. Most countries determine currency values through supply and demand in forex markets (discussed further in later chapters).
Role of speculators
Speculators are investors who buy or sell financial assets with the aim of making profits from short-term price movements.
The main drivers of global financial flows are speculators and currency traders who shift billions of dollars between markets for:
- Speculative purposes: deriving short-term profits from currency and asset price movements
- Technical purposes: hedging against future exchange rate movements and minimising risk
Based on Bank for International Settlements data, only a small share of foreign exchange transactions serves "real" economic purposes (trade and investment). The vast majority is speculative or technical, highlighting the dominance of financial market activity over underlying economic fundamentals.
Benefits and risks of financial flows
Benefits:
- Enable countries to obtain funds for domestic investment
- Particularly important for countries with low national savings
- Allow higher levels of investment and economic growth than would otherwise be possible
Risks:
- Create significant volatility in foreign exchange and domestic financial markets
- Speculative behaviour can create "herd mentality" effects
- Can trigger currency falls and financial crises (e.g., Britain 2016, Turkey 2021, Argentina repeatedly)
The International Monetary Fund (IMF) is an international agency of 190 members that oversees the stability of the global financial system. The IMF stabilises economies experiencing currency crises to prevent flow-on effects to other economies.
Investment and transnational corporations
Distinguishing finance from investment
Whilst similar, global finance and global investment can be distinguished:
- Finance: shorter-term, speculative shifts of money
- Investment: longer-term flows of money to buy or establish businesses
Foreign direct investment (FDI)
Foreign Direct Investment (FDI) involves the movement of funds between economies to establish a new company or buy a substantial proportion of shares (10% or more) in an existing company. FDI is generally long-term, with investors intending to play a role in business management.
Growth and trends in FDI
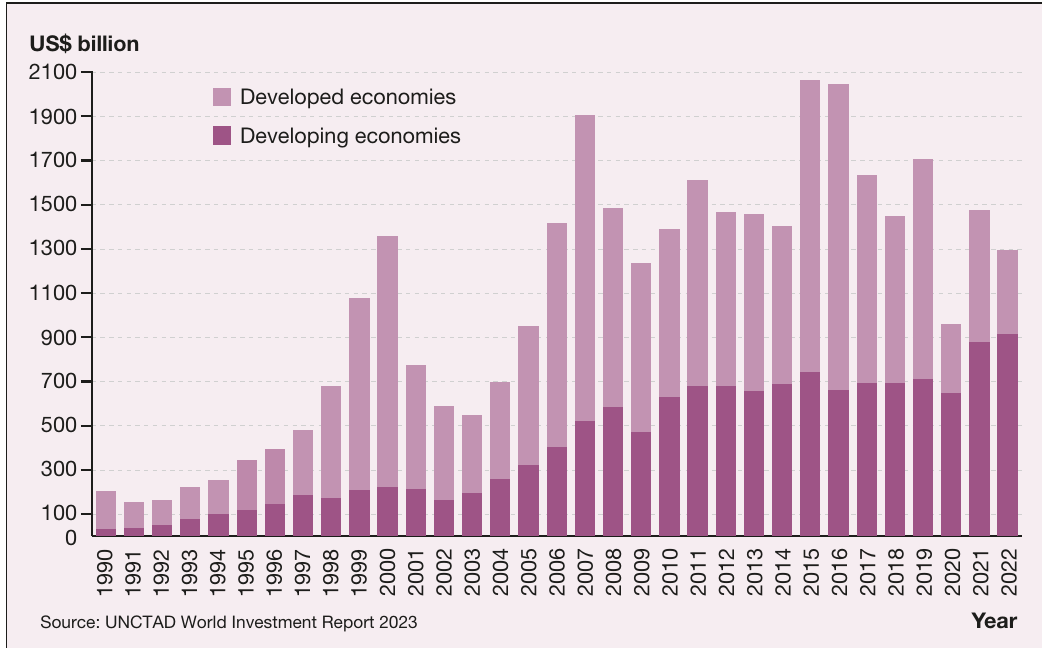
Since the 1980s, FDI has grown dramatically following reforms in developed and developing countries. Key trends:
Impact of economic conditions:
- Global recession (late 2000s): sharp fall in FDI
- 2010s: sustained high levels of FDI
- 2020: COVID-19 caused FDI to fall below US$1 trillion for the first time in nearly two decades
- 2021: quick recovery
Changing direction:
- Traditionally, FDI favoured developed nations (Europe, North America, Japan) due to greater industrial capacity and larger consumer markets
- Since 2020: developing economies receive the majority of FDI
- 2021: US$916 billion to developing countries, with US$662 billion to Asia alone
- China and Hong Kong: US$307 billion
- Singapore: US$141 billion
- India: US$49 billion
Source countries:
- Developing economies now contribute 31% of global FDI (2021)
- Up from around 15% in the mid-2000s
Transnational corporations (TNCs)
TNCs play a vital role in global investment flows and account for roughly half of global trade. These corporations often have:
- Production facilities in multiple countries
- Global value chains sourcing inputs from various countries
- Manufacturing in one country, packaging and marketing in another
Around 80% of trade occurs in global value chains according to UNCTAD analysis, demonstrating the central role of TNCs in facilitating international exchange.
Growth in TNCs:
- Early 1990s: 37,000 TNCs with 170,000 affiliates
- Current: 104,000 TNCs with over 1,116,000 affiliates
- Foreign affiliates employ over 83 million people globally
Government incentives: TNCs bring foreign investment, new technologies, skills and knowledge. Governments often encourage TNCs through:
- Subsidies
- Tax concessions
Digital TNCs: Digital industry TNCs experienced particularly rapid growth during the pandemic. Total sales for the top 100 digital TNCs grew 159% over five years to 2021 – four times faster than the top 100 traditional TNCs.
Challenges: As TNCs increase in volume and significance, cross-border cartels between large corporations have also increased, reducing competition and disadvantaging consumers. Global fines for cartels reached $4.6 billion in 2021, though many arrangements remain undetected.
Mergers and acquisitions
International mergers and takeovers have driven investment growth. Recent large-scale mergers include:
- Salesforce and Slack (technology)
- AstraZeneca and Alexion Pharmaceuticals (pharmaceuticals)
- Walt Disney Company and 21st Century Fox (media)
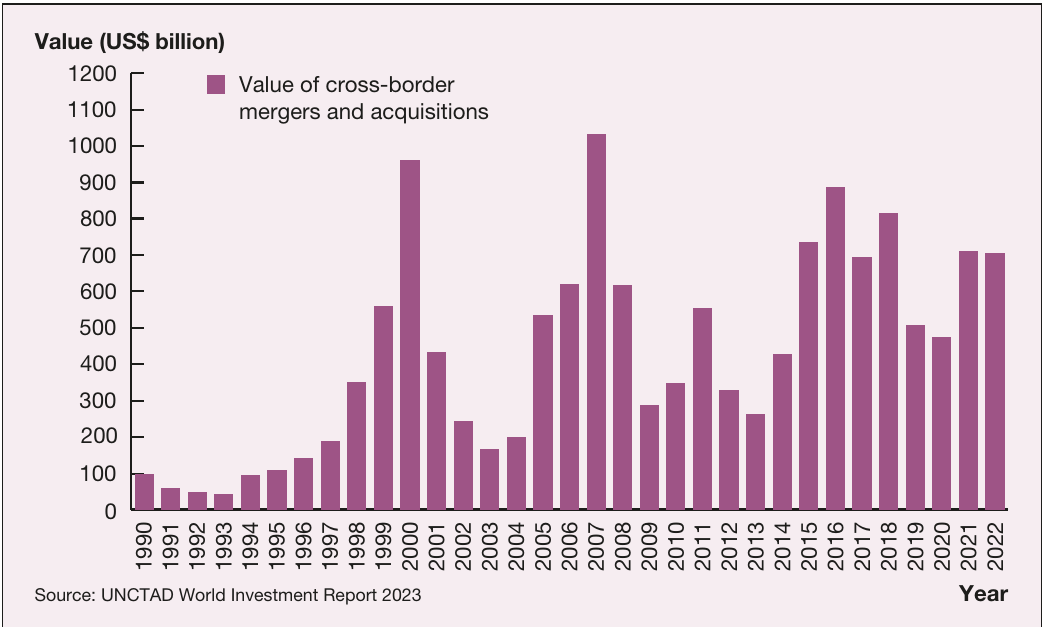
The peak year for cross-border mergers and acquisitions (M&As) was 2007 at US$1 trillion. M&As typically move with global economic conditions, falling when growth slows. In 2022, M&As stood at US$706 billion.
Domestic vs foreign investment
Despite growth in FDI, most investment in economies still comes from domestic sources. FDI typically accounts for less than 20% of total investment, meaning over 80% comes from within national economies.
Technology, transport and communication
Technology as a driver of globalisation
Technology plays a central role in globalisation by facilitating economic integration. Key examples include:
Freight technology:
- Micro warehouses near customers improve "last mile" logistics
- Blockchain technology simplifies tracking
- WTO estimates digitisation of trade could cut trade costs by 6%
International communication:
- High-speed broadband enables commercial services provision worldwide
- OECD 2023 study: digital connectivity has three times larger impact on reducing trade costs today than in 1995
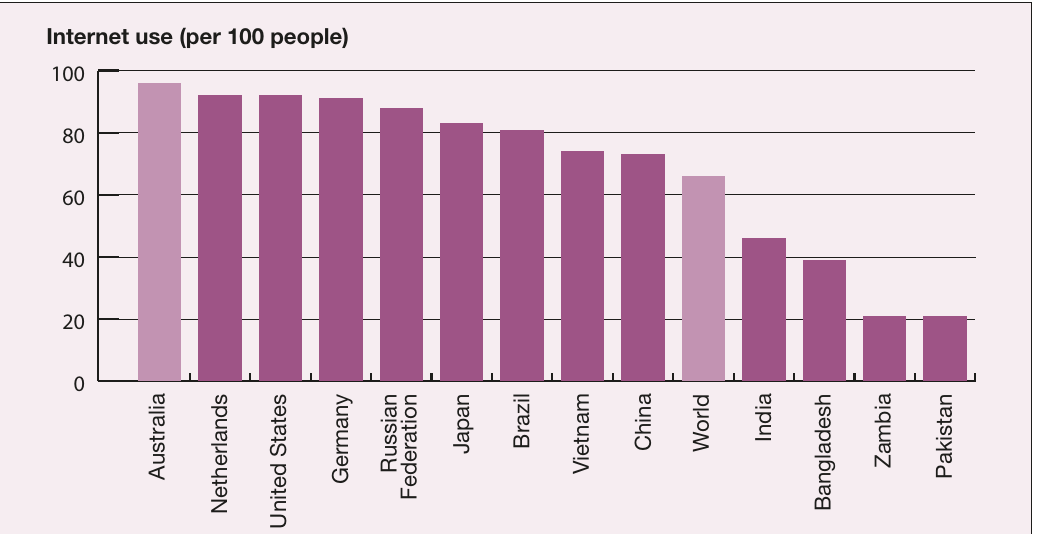
- Global population using internet: 7% (2000) to 67% (2022)
Finance and investment:
- Secure, high-speed networks allow money to move globally in fractions of a second
Mobile technology:
- Smartphones fundamentally changing retail, transport, education, leisure and professional services
- Mobile phone subscriptions: over 8 billion (roughly equal to world population)
Transportation:
- Longer non-stop flights
- High-speed rail networks
- Greater labour mobility and tourism accessibility
Impact on economic integration
Technology enables integration at unprecedented depth. OECD research (2023) found:
- 1% increase in bilateral digital connectivity increases domestic trade by 2.1%
- 1% increase in bilateral digital connectivity increases international trade by 1.5%
Economies adapting rapidly to new technologies tend to be most closely integrated with other economies in their region or worldwide. This creates a competitive advantage for technologically advanced nations.
The digital divide
The COVID-19 pandemic highlighted disparities in technology access between countries. Countries with high digital technology use (Israel, Netherlands, Australia) coped better with lockdowns through:
- Digital marketplaces
- Virtual meetings
- Online learning
Countries with lower digital access faced greater challenges.
Technology as a trade opportunity
For leading technology innovators and exporters, technology represents a major trade opportunity. The United States earns substantial export revenues from global leadership in many technology areas, reflected in 59% of the top 100 digital TNCs being headquartered there.
Other countries import technology from developed economies, hoping to eventually become innovators themselves. Countries like India, South Korea, and Israel have successfully developed their own technology exports.
Trade spreads new technologies, though leading countries can often retain technological superiority for extended periods due to ongoing innovation.
Technology-driven investment
Corporations leading in new technology development often move directly into overseas markets. Examples include Google, Salesforce, and IBM with extensive global operations.
These corporations bring know-how and invest substantially in education and training in new markets. This is particularly apparent for digital TNCs with less reliance on physical assets. E-commerce TNCs increased greenfield investments (building foreign subsidiaries from scratch) by 120% in 2020 and a further 10% in 2021.
Internet and global connectivity
The internet provides a communications backbone linking businesses, individuals and nations. This:
- Allows greater communication within and between firms
- Reduces business costs previously acting as barriers to integration
The World Information Technology and Services Alliance (WITSA) estimates the global marketplace for information and communications technology is worth almost US$5 trillion.
Worldwide internet usage has surged to five billion users, demonstrating rapid technology spread and increasingly interconnected global economy. COVID-19 accelerated this trend, with international internet traffic roughly doubling in 2020.
However, increased globalisation of online information flows requires regulations to mitigate cybersecurity attacks, which increased by almost 40% globally in 2022.
International division of labour and migration
Labour markets and globalisation
Labour markets differ from markets for goods, services, finance and investment in being far less internationalised. Whilst money moves in fractions of a second, goods in days, and investments in weeks, people do not move jobs as freely. Industrialised countries have become more restrictive about immigration from poorer countries.
Nevertheless, more people than ever are moving countries for better work opportunities.
Migration statistics
Key figures:
- 184 million people live outside their country of nationality (World Bank)
- Around half come from low- and middle-income countries
- 164 million migrant workers (approximately 2% of world population) (International Labour Organisation)
Labour migration into OECD countries fell following the global financial crisis due to reduced job opportunities, gradually recovering during the 2010s. Migration has continued growing despite COVID-19, reflecting:
- 'Push' factors: people leaving countries due to conflict and violence
- 'Pull' factors: demand for workers in many countries
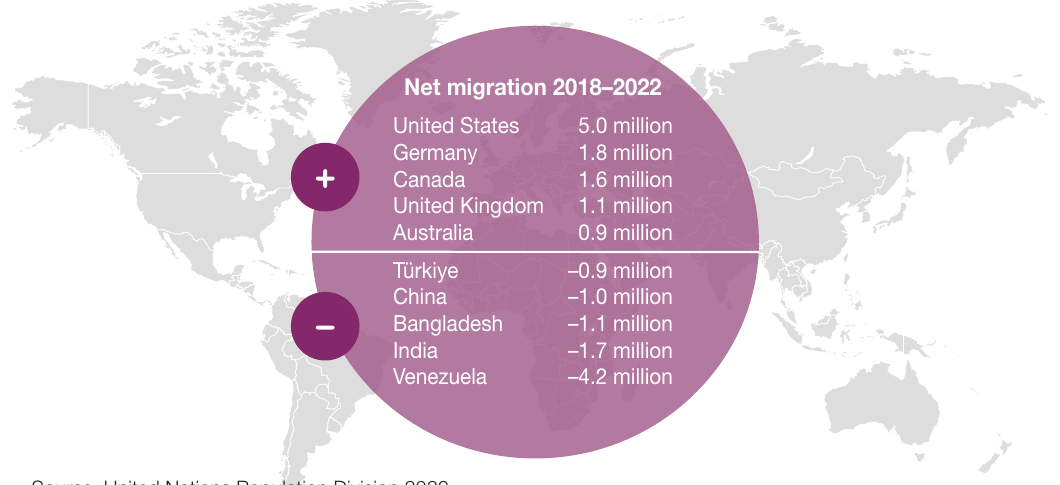
Net migration statistics show that, with rare exceptions, the number of people moving between countries remains low relative to population sizes. In 2023, over 8 million Ukrainians were displaced due to war.
Patterns of labour movement
Labour movement appears concentrated at opposite ends of the labour market:
Top end (highly skilled workers):
- Attracted to larger, higher-income economies (Europe, United States)
- Higher pay and better job opportunities
- ILO estimates two-thirds of international migrant workers moved to high-income economies
- Creates a "brain drain" for smaller advanced economies (Australia, New Zealand)
- Effectively creates a global market for highly skilled labour
Bottom end (low-skilled workers):
- Advanced economies demand low-skilled labour for jobs locals may not want
- Jobs requiring only basic skills (potentially not advanced language skills)
- Migration patterns:
- United States: predominantly Latin America
- Europe: mainly Eastern Europe and Africa
- Richer Asian countries: lower-income regional economies
Low-skilled labour migrants often remit earnings back to families. In 2021, economies received US$614 billion in remittances, with India, Mexico and the Philippines as main destinations.
Barriers to labour mobility
Despite increasing globalisation, significant barriers to working in other countries remain:
- Immigration restrictions
- Language differences
- Cultural factors
- Incompatible educational and professional qualifications
Most people prefer staying in their birth country where family, friends, language and culture are familiar. However, domestic instability and geopolitical turmoil may force displacement. The UNHCR estimates 103 million people were forcibly displaced by mid-2022, the highest figure on record.
International division of labour
The international division of labour describes how tasks in the production process are allocated to different people in different countries worldwide.
This concept is evident in two ways:
People moving to jobs: Workers migrate to where their skills are needed, as discussed above.
Jobs moving to people: Corporations shift production between economies seeking efficient, cost-effective labour. Many producers operate global supply chains (or global value chains) with production facilities in several countries.
Offshoring allows companies to shift production between countries to reduce costs. IMF research (2022) found global supply chains operated successfully during COVID-19, with less-affected countries able to supply goods when others were harder hit.
However, many governments have since taken steps to reduce reliance on global supply chains and promote "on-shoring" of essential industries.
Whilst offshoring has occurred for decades in labour-intensive manufacturing, recent years have seen services functions (IT support, data management, accounting) also move to more competitive locations.
Comparative advantage
The international division of labour reflects the economic concept of comparative advantage: economies should specialise in producing goods or services they can produce at the lowest opportunity cost.
- Developing economies: large populations with basic labour skills and education give comparative advantage in labour-intensive manufacturing
- Advanced economies: shifted away from labour-intensive manufacturing to specialised services using highly skilled workers in greater supply
Remember!
Key concepts:
- Globalisation: increasing integration and interdependence of national economies through movement of goods, services, capital, technology and people
- Gross World Product (GWP): sum of total output by all economies worldwide
- Five main indicators: trade, financial flows, investment and TNCs, technology/transport/communication, labour migration
Trade trends:
- Global trade grew from US$4.3 trillion (1990) to US$27.9 trillion (2022)
- Manufacturing dominates but declining share; services fastest-growing
- Trade direction shifting from high-income economies (85% to 64%) to East Asia and Pacific (6% to 20%)
Financial flows:
- Finance is the most globalised sector
- Forex markets reach US$7.5 trillion daily turnover
- Speculators drive most flows for short-term profits
- Greater volatility and crisis risk than other indicators
Investment:
- FDI now favours developing economies, especially Asia
- 104,000 TNCs with over 1 million affiliates globally
- Digital TNCs growing four times faster than traditional TNCs
Technology:
- Central driver enabling deeper integration
- 67% of global population online (2022)
- Digital connectivity reduces trade costs
- "Digital divide" creates disparities between countries
Migration:
- 164 million migrant workers (2% of world population)
- Concentrated at high-skill and low-skill ends of labour market
- Creates international division of labour based on comparative advantage
- Significant barriers remain compared to flows of money and goods