Using Graphs to Solve Equations and Inequalities (HSC SSCE Mathematics Advanced): Revision Notes
Using Graphs to Solve Equations and Inequalities
Introduction to graphical methods
Graphical methods provide a powerful way to solve equations that are difficult or impossible to solve algebraically. The main advantages of using graphs are:
- You can quickly see how many solutions exist by counting intersection points
- You can identify if solutions exist at all
- You can find approximate values for solutions
- The visual representation makes the mathematical situation clear
- Once you understand the situation graphically, you can often find exact solutions algebraically
The advantage of graphical approaches is that once the graphs are drawn, it is usually obvious from the picture how many solutions there are and roughly where they are located. This visual understanding often guides us toward finding exact algebraic solutions.
Constructing two functions from a given equation
To solve an equation graphically, you create two separate functions from the equation.
The basic method
For an equation like :
- Take the left-hand side (LHS) and create the function
- Take the right-hand side (RHS) and create the function
- Graph both functions on the same set of axes
- Find where the graphs intersect
Sometimes it helps to rearrange the equation before creating your two functions. Choose a rearrangement that makes both functions easy to sketch.
Example: Solving
Let's examine this equation that cannot be solved algebraically.
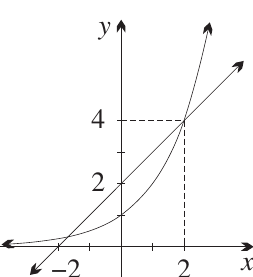
When we graph and together, we can see:
- The graphs intersect twice, so there are two solutions
- One solution is exactly , because , so the point lies on both graphs
- The other solution is just to the right of , approximately
Refining approximate solutions
When you find an approximate solution from the graph, you can make it more accurate using:
- Careful plotting on graph paper with precise scales
- Trial and error on a calculator, testing values near your estimate
- Graphing software that can calculate intersection points
Counting the number of solutions
Often you only need to know how many solutions exist and roughly where they are located, rather than exact values.
Worked Example: Investigating
Let's determine how many solutions this equation has.
Step 1: Graph both functions
- (a parabola opening downward with maximum at )
- (a hyperbola)
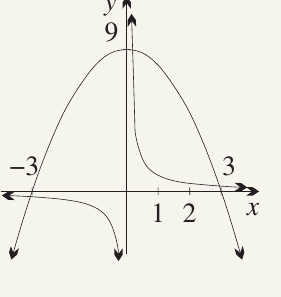
Step 2: Count the intersection points
The two graphs intersect at three points, so the equation has three solutions:
- One solution just to the left of
- One solution just to the right of
- One solution just to the left of
Key method: Graphical solution of an equation
To solve an equation graphically:
- Sketch the graphs of and on one pair of axes
- Consider whether rearranging the equation first would be helpful
- The solutions are the x-coordinates of any points of intersection
- The graph shows you:
- How many solutions exist
- Approximate locations of the solutions
This method gives you both quantitative information (how many solutions) and qualitative information (where they are).
Solving inequations using graphs
Graphical methods are equally useful for inequations (inequalities). The key is to compare which function lies above the other.
Example: Solving
Using our earlier graph where and intersect at approximately and :
- The inequality asks: where is the curve below the line ?
- From the graph, this occurs between the two intersection points
- Solution: (approximately)
Key method: Graphical solution of an inequation
To solve an inequation graphically:
- Sketch the graphs of and on one pair of axes
- Examine which curve lies above or below the other at different values of
For inequalities:
- : Find where the LHS curve is above the RHS curve
- : Find where the LHS curve is below the RHS curve
- or : Include the intersection points in your solution
Absolute value equations and inequations
Absolute value problems benefit greatly from graphical solutions because the sketch makes the situation clear.
Worked Example: Solving equations and inequations
Let's work through a complete example involving the absolute value function .
Part a: Draw the graph of
To sketch this absolute value function:
- Find the x-intercept: Set
- Find the y-intercept: Set
The graph forms a V-shape with vertex at .
Part b: Write equations for both branches
The absolute value function has two linear pieces:
- For : (right-hand branch)
- For : (left-hand branch)
Part c: Draw on the same diagram
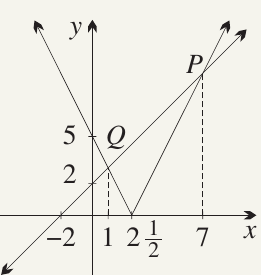
Part d: Find the intersection points P and Q
We solve algebraically for each intersection:
Finding P (right branch):
So
Finding Q (left branch):
So
Part e: Solve
From the graph, the two functions intersect at points P and Q.
Solution: or
Part f: Solve
We need to find where the V-shaped graph is on or above the line .
From the graph, this occurs:
- To the left of Q (including Q):
- To the right of P (including P):
Solution: or
When working with absolute value inequations, pay careful attention to whether the inequality includes the boundary points (≤ or ≥) or not (< or >). This determines whether you include the x-coordinates of the intersection points in your solution.
Key Points to Remember:
- Graphical solutions show the big picture: You can immediately see how many solutions exist and approximately where they are
- Solutions are x-coordinates of intersections: Where and cross, the x-value is a solution
- For inequations, compare heights: Determine which function is above or below the other across different regions
- Absolute value creates V-shapes: Split the absolute value function into two linear pieces at the vertex
- Verify algebraically when possible: Once the graph reveals the structure, find exact solutions using algebra