Dot Plots & Stem-and-Leaf Plots (HSC SSCE Mathematics Standard): Revision Notes
Dot Plots & Stem-and-Leaf Plots
What is a dot plot?
A dot plot is a simple and effective way to display numerical data. It uses a horizontal number line with dots placed above it to represent individual data values. When multiple data points share the same value, the dots are stacked vertically on top of each other, making it easy to see which values occur most frequently.
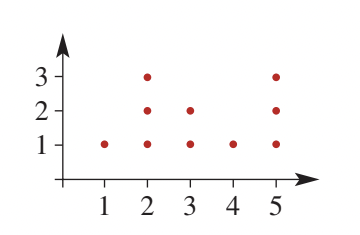
Dot plots work particularly well for smaller data sets where the data takes only a limited range of values. They provide a clear visual picture of how the data is distributed.
Dot plots are especially useful when you want to see both the individual data values and the overall distribution pattern at the same time. The stacking of dots creates a visual representation of frequency without needing a separate frequency axis.
Key features of dot plots
- Each dot represents one data value
- Dots are positioned above their corresponding value on the number line
- Multiple occurrences of the same value result in stacked dots
- The height of each stack shows the frequency of that value
- The horizontal axis shows the range of possible values
How to construct a dot plot
Follow these steps to create an accurate dot plot:
Step 1: Draw a horizontal number line that covers the full range of your data values. Make sure the scale includes the smallest and largest values in your data set.
Step 2: Label the horizontal axis with the variable name (such as "Hours", "Age", or whatever you are measuring).
Step 3: Add a vertical axis to indicate frequency, though this is optional. The stacked dots themselves show frequency visually.
Step 4: Plot each data value by placing a dot directly above its corresponding position on the number line. If a value appears multiple times, stack the dots vertically.
Step 5: Count all the dots to verify your total matches the number of data values in your original data set.
Always verify your work: Count all the dots in your completed plot to ensure the total matches the number of values in your original data set. This simple check catches most common errors.
Worked Example: Constructing a Dot Plot
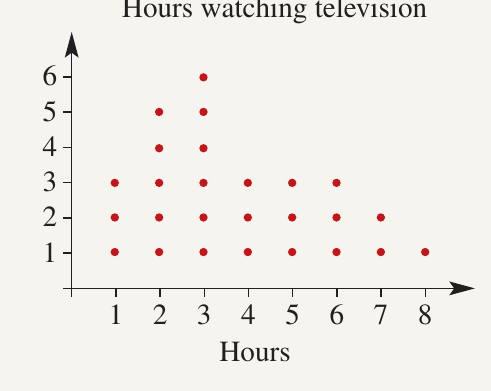
Question: The number of hours students spent watching television over a weekend is recorded below. Construct a dot plot to display this data.
| 3 | 4 | 3 | 2 | 7 | 6 | 2 | 2 | 3 | 7 | 3 | 5 | 2 |
|---|---|---|---|---|---|---|---|---|---|---|---|---|
| 3 | 4 | 5 | 6 | 8 | 1 | 6 | 1 | 2 | 3 | 4 | 1 | 5 |
Solution:
Draw a horizontal number line from to (the minimum and maximum values in the data set).
Label the axis "Hours" to show what is being measured.
The vertical direction will show frequency, with each dot representing one person.
Plot each value from the data set as a dot. For example, the first value is , so place a dot above on the number line. Continue with each data value, stacking dots when values repeat.
Count your dots to check: The data set contains 26 values, so you should have 26 dots in total.

Exam tip: Always count your dots at the end to make sure you haven't missed any data values or accidentally added extras.
What is a stem-and-leaf plot?
A stem-and-leaf plot (also called a stem plot) is a method for organising and displaying numerical data, particularly useful for data sets with fewer than 50 values. This type of plot preserves the individual data values while showing the overall distribution.
The plot works by splitting each number into two parts:
- The stem represents the tens digit
- The leaf represents the units digit
Both stems and leaves are arranged in numerical order, making it easy to identify patterns, clusters, and outliers in the data.
One major advantage of stem-and-leaf plots over other displays is that they retain all the original data values. You can reconstruct the complete data set from the plot, which isn't possible with histograms or bar charts.
Structure of stem-and-leaf plots
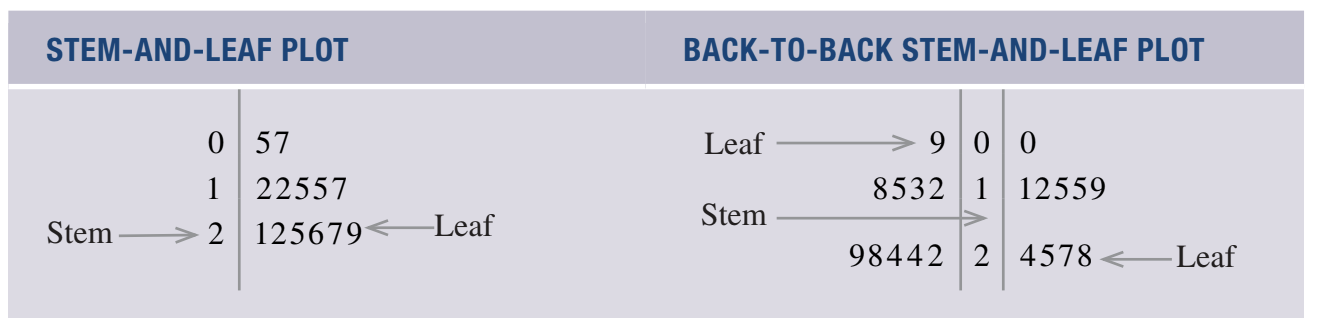
A basic stem-and-leaf plot has stems written vertically down the left side, separated from the leaves by a vertical line. The leaves for each stem are written horizontally across the page in increasing order.
For example, the number would have:
- Stem: (the tens digit)
- Leaf: (the units digit)
A back-to-back stem-and-leaf plot is used to compare two related data sets. The stems are written in the centre, with leaves for one data set on the left and leaves for the other data set on the right. This format makes it easy to compare distributions between two groups.
How to construct a stem-and-leaf plot
Follow these steps to create a stem-and-leaf plot:
Step 1: Examine your data to find the smallest and largest values. This determines which stems you need. For example, if your data ranges from to , you need stems , , , and .
Step 2: Write the stems in a vertical column in numerical order (smallest to largest), followed by a vertical line.
Step 3: Go through each data value and attach its leaf to the appropriate stem. For example, if your first value is , write next to stem . Continue this process for all values.
Step 4: Once all leaves are attached, rewrite them in numerical order from smallest to largest for each stem.
Critical step: Don't forget Step 4! Many students lose marks by forgetting to arrange the leaves in numerical order. Your final plot should have all leaves sorted from smallest to largest for each stem.
Worked Example: Constructing a Stem-and-Leaf Plot
Question: Use the following data set to construct a stem-and-leaf plot.
, , , , , , , , , , , , , , , , , , , , , , , ,
Solution:
The data ranges from to . This means we need stems: , , , and .
Write these stems vertically:
0 |
1 |
2 |
3 |
Work through the data values one by one, attaching each leaf to its stem.
The first value is : stem , leaf . Write next to stem .
The second value is : stem , leaf . Write next to stem .
Continue this process for all data values.
After attaching all leaves, reorder them from smallest to largest for each stem:
0 | 5 6 6 6 7 9
1 | 0 0 1 4 5 8 9 9 9
2 | 4 5 5 6 7 8 8 9 9
3 | 0
Exam tip: Always write your leaves in numerical order in the final version. This makes it much easier to read the plot and identify patterns in the data.
Back-to-back stem-and-leaf plots
A back-to-back stem-and-leaf plot allows you to compare two related data sets side by side. The stems are positioned in the centre, with leaves for the first data set extending to the left and leaves for the second data set extending to the right.
This format is particularly useful for comparing data between two groups, such as males versus females, or two different time periods.
Back-to-back plots make it easy to spot differences in distributions between two groups. You can quickly compare medians, ranges, and overall shapes by looking at how the leaves are distributed on each side.
How to construct a back-to-back stem-and-leaf plot
The process is similar to creating a regular stem-and-leaf plot, but you work with two data sets simultaneously:
Step 1: Identify the range of values across both data sets to determine which stems you need. Write these stems vertically in the centre, preceded by two vertical lines.
Step 2: Attach the leaves for the first data set to the left of the stems. Work through each value systematically.
Step 3: Attach the leaves for the second data set to the right of the stems. Again, work through each value in order.
Step 4: Rewrite all leaves in numerical order. For the left side, arrange leaves from largest to smallest (as you move away from the stem). For the right side, arrange leaves from smallest to largest.
Ordering direction matters: In a back-to-back plot, leaves on the left should increase as you move away from the stem (reading left), while leaves on the right should increase as you move away from the stem (reading right). Getting this wrong is a common mistake!
Worked Example: Constructing a Back-to-Back Stem-and-Leaf Plot
Question: The following data shows test scores for girls and boys. Construct a back-to-back stem-and-leaf plot to compare the two groups.
| Girls | 28 | 24 | 24 | 31 | 34 | 26 | 27 | 12 | 18 | 13 | 15 | 6 | 29 | 30 | 22 |
|---|---|---|---|---|---|---|---|---|---|---|---|---|---|---|---|
| Boys | 19 | 27 | 21 | 25 | 35 | 28 | 29 | 13 | 11 | 30 | 31 | 32 | 25 | 16 | 9 |
Solution:
The combined data ranges from to , so we need stems , , , and .
Set up the structure with stems in the centre:
Girls | 0 1 2 3 | Boys
For the girls' data, the first value is . This has stem and leaf . Write to the left of stem .
Continue attaching all girls' leaves to the left side of their respective stems.
For the boys' data, the first value is . This has stem and leaf . Write to the right of stem .
Continue attaching all boys' leaves to the right side of their respective stems.
Finally, reorder the leaves. On the left (girls' side), arrange leaves from largest to smallest as you move away from the stem. On the right (boys' side), arrange leaves from smallest to largest:
Girls        |   | Boys
           6 | 0 | 9
      8 5 3 2 | 1 | 1 3 6 9
9 8 7 6 4 4 2 | 2 | 1 5 5 7 8 9
      4 1 0   | 3 | 0 1 2 5
Exam tip: In a back-to-back plot, remember that the girls' leaves should increase as you read from the stem outward (to the left), and the boys' leaves should increase as you read from the stem outward (to the right).
Key Points to Remember:
-
Dot plots display data as dots above a number line, with stacked dots showing repeated values. They work best for small data sets with limited values.
-
To construct a dot plot: draw and label a number line, plot each data value as a dot, stack dots for repeated values, and verify your total count.
-
Stem-and-leaf plots organise numerical data by splitting values into stems (tens digits) and leaves (units digits), both arranged in numerical order. Use these for data sets with fewer than 50 values.
-
Back-to-back stem-and-leaf plots compare two data sets side by side, with shared stems in the centre and leaves extending left and right.
-
Always arrange leaves in numerical order in your final plot, and remember to include all necessary labels so your plot is easy to interpret.
-
Count your data points or check your leaves to ensure you haven't missed any values - this simple verification step prevents most common errors!