Real-World Examples (HSC SSCE Mathematics Standard): Revision Notes
Real-World Examples
Understanding how to interpret and analyse real-world data is an essential skill in mathematics. This note explores practical examples of working with tables, line graphs, and pie charts using data about motor vehicle accidents, rainfall patterns, and household water usage.
Motor vehicle statistics
Motor vehicle accidents are a significant concern for governments worldwide. Data about road incidents, including deaths, injuries, and damage, is collected and analysed to identify patterns and develop strategies to reduce accidents.
Governments collect and analyse statistical data about road accidents to understand contributing factors and implement appropriate safety measures. This data-driven approach helps create more effective road safety policies.
Common causes of road accidents
Several factors can contribute to motor vehicle accidents:
- Poor driving skills
- Speeding
- Alcohol consumption
- Driver fatigue
- Poor road design
- Lack of vehicle maintenance
These factors are carefully tracked in accident statistics, allowing authorities to identify the most significant causes and target interventions accordingly.
Reading tables of accident statistics
Tables provide an organised way to present data about road accidents. Let's look at an example involving fatigue-related accidents.
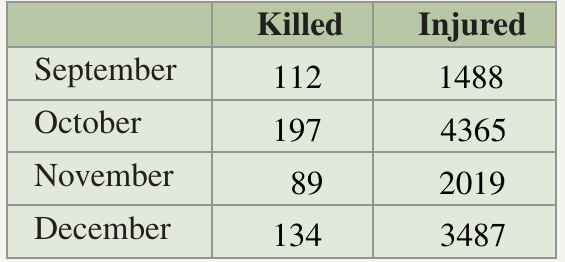

The table above shows casualty data from road accidents involving fatigue during the last four months of a year. We can extract various pieces of information from this table and perform calculations.
Worked Example: Motor vehicle accident statistics
Consider a table showing fatigue-related road accidents:
| Month | Killed | Injured |
|---|---|---|
| September | 112 | 1488 |
| October | 197 | 4365 |
| November | 89 | 2019 |
| December | 134 | 3487 |
Question a: How many deaths occurred in road accidents during October involving fatigue?
Solution:
Look at the intersection of the October row and the Killed column.
Answer: deaths
Question b: Which month had the least number of injuries in road accidents involving fatigue?
Solution:
Scan down the Injured column to find the lowest value, which is .
Answer: September
Question c: How many deaths in road accidents involving fatigue occurred in the four months?
Solution:
Add all the values in the Killed column:
Answer: deaths
Question d: What is the percentage increase in number of injuries involving fatigue from November to December?
Solution:
First, find the increase in injuries:
Now express this increase as a percentage of November's injuries:
Answer: Approximately 73% increase
Exam tip: When calculating percentage increase, always divide the increase by the original (earlier) value, not the final value. This is a common mistake that leads to incorrect answers.
Water usage
Water is a precious resource in Australia, and understanding patterns in rainfall and water consumption helps governments and households manage this resource effectively.
Rainfall patterns
Climate change is affecting rainfall patterns across Australia. Changes in carbon dioxide concentration in the atmosphere are leading to more variable weather, including increased droughts and floods. Despite these variations, Australia's overall annual mean rainfall has shown a slight increase over the past century.
Interpreting rainfall line graphs
Line graphs are useful for showing how rainfall varies over time and for comparing rainfall between different locations.
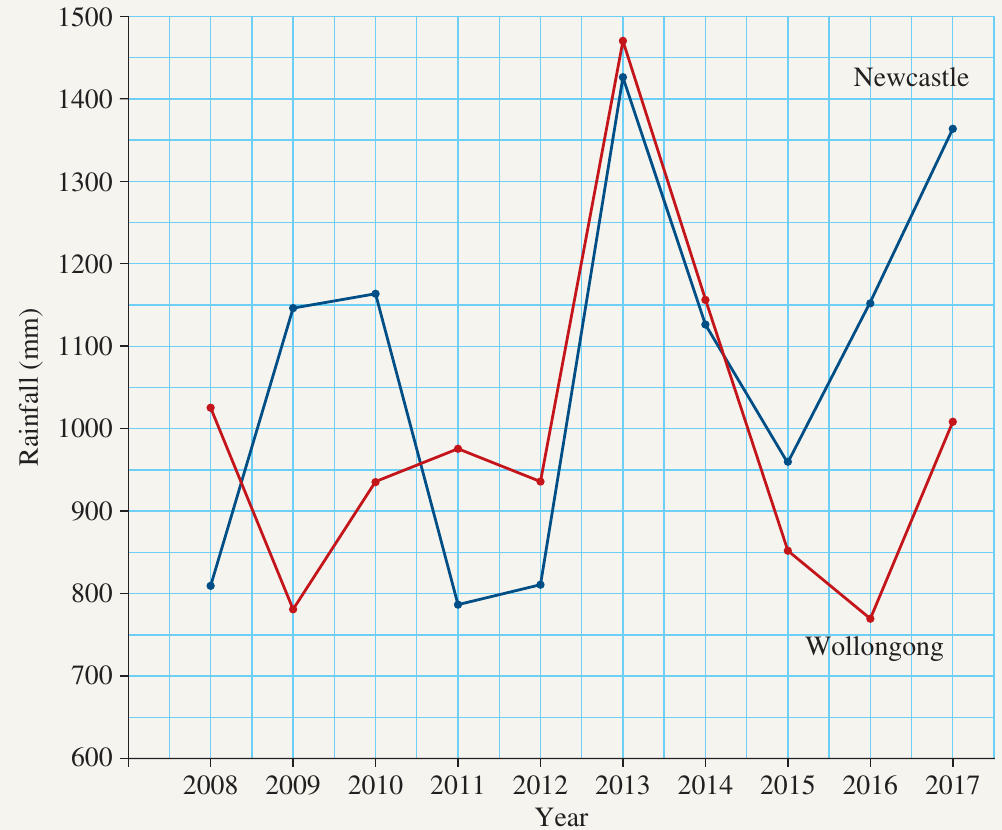
The graph above compares annual rainfall data for Newcastle (shown in dark blue) and Wollongong (shown in red) over a 10-year period from 2008 to 2017.
When interpreting line graphs with multiple data sets, pay attention to:
- The scale on both axes
- The legend identifying each line
- Points where lines intersect or diverge significantly
- Overall trends (increasing, decreasing, or stable patterns)
Worked Example: Rainfall data interpretation
Question a: What was the annual rainfall for Newcastle in 2015?
Solution:
Locate 2015 on the horizontal axis, then read up to the Newcastle line (dark blue) and across to the vertical axis.
Answer: mm
Question b: Which was the wettest year during this 10-year period for Wollongong?
Solution:
Look for the highest point on the Wollongong line (red), which occurs in 2013.
Answer: 2013
Question c: Which year has the largest difference in annual rainfall between the two cities?
Solution:
Find where the vertical gap between the two lines is greatest. This occurs in 2016, where Newcastle had much higher rainfall than Wollongong.
Answer: 2016
Household water usage
Water availability varies from year to year, and during drought periods, governments often impose water restrictions to help conserve supplies. Understanding how households use water can help identify opportunities for conservation.
Interpreting pie charts of water usage
Pie charts are effective for showing how a total amount is divided into different categories. Each sector's size is proportional to the percentage it represents of the whole.
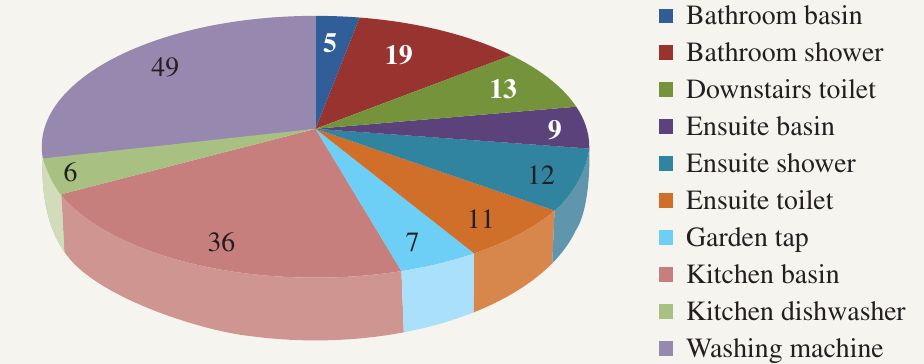
The pie chart above displays annual water usage in kilolitres for different fixtures and appliances in a family home.
Worked Example: Household water usage analysis
Question a: How many kilolitres of water were used by this family in a year?
Solution:
Add all the values from each sector of the pie chart:
Answer: kL
Question b: What percentage of the total water use is in operating the washing machine?
Solution:
The washing machine uses kL out of a total of kL.
Calculate the percentage:
Answer: Approximately 29%
Question c: A dual-flush toilet saves 60% of the water used in a conventional toilet. How many kilolitres per year would be saved by replacing the toilets with dual-flush toilets?
Solution:
First, find the total water used by all toilets:
Calculate 60% of this amount:
Answer: Two dual-flush toilets would save kL per year
Exam tip: When working with percentages, remember to convert them to decimals by dividing by 100. For example, . This ensures accurate calculations.
Key Points to Remember:
- Tables organise data in rows and columns, making it easy to compare values and calculate totals or percentages.
- Line graphs are excellent for showing trends over time and comparing multiple data sets on the same axes.
- Pie charts display how a whole is divided into parts, with each sector representing a proportion of the total.
- Percentage increase is calculated using the formula:
- Real-world data analysis helps governments and individuals make informed decisions about important issues like road safety, climate patterns, and resource conservation.