Measures of Central Tendency (HSC SSCE Mathematics Standard): Revision Notes
Measures of Central Tendency
Measures of central tendency are statistical values that describe the centre or typical value of a dataset. The three main measures you need to know are the mean, median, and mode. Each measure provides different information about your data and is useful in different situations.
Choosing the right measure depends on your data:
- Use the mean for normally distributed numerical data without extreme values
- Use the median when data contains outliers or is skewed
- Use the mode for categorical data or to find the most common value
Mean
The mean is what most people call the "average". To find the mean, add all the values together and divide by how many values you have.
Notation for the mean
There are two different symbols used for the mean, depending on whether you're working with a population or a sample:
- Population mean: denoted by the Greek letter (mu)
- Sample mean: denoted by (x-bar)
Understanding Population vs Sample
A population includes all members of a group (e.g., all students in a school), while a sample is just a subset of that group (e.g., students in one class). In practice, we often work with samples because it's impractical to measure entire populations.
Formula for the mean
For ungrouped data:
Or using mathematical notation:
where:
- means the sum of all values
- is the number of values
Mean from grouped data
When data is organised into a grouped frequency table, we cannot use the exact individual scores because we only know which class interval each score falls into. Instead, we use the class centre (the midpoint of each class interval) to represent all scores in that class.
For grouped data, the formula becomes:
where:
- is the frequency (how many scores are in each class)
- is the class centre
- is the frequency multiplied by the class centre
Critical Concept: Approximation in Grouped Data
The mean calculated from grouped data is an approximation because we're using class centres rather than the actual individual scores. This means the result won't be exactly the same as if you had calculated using all the original data points.
Worked Example: Finding the Mean from a Grouped Frequency Table
A rugby team's points scored over two seasons are shown in this grouped frequency table:
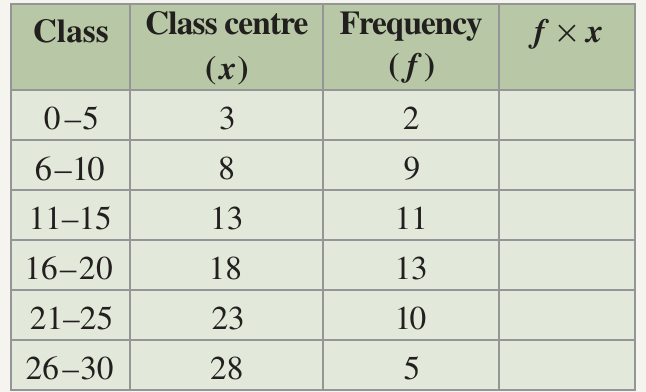
To find the mean number of points scored:
Step 1: Complete the column by multiplying each class centre by its frequency.
Step 2: Add up all the frequencies to find .
Step 3: Add up all the values to find .
Step 4: Use the formula .
Here's the completed table with calculations:
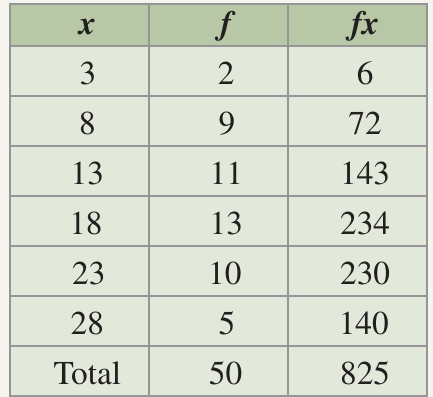
Step 5: Substitute the values into the formula.
Answer: The mean number of points scored is 16.5
Median
The median is the middle value when all the data is arranged in order from smallest to largest. The median is particularly useful when your data contains extreme values (outliers) that might distort the mean.
When to Use the Median
The median is more representative than the mean when dealing with skewed data or datasets containing outliers. For example, in income statistics, the median income is often reported because a few very high incomes can significantly inflate the mean, making it less representative of typical earnings.
How to calculate the median
Step 1: Arrange all the scores in increasing order (from smallest to largest).
Step 2: Count the total number of scores. Use the letter to represent this number.
Step 3: Find the position of the median:
- If there is an odd number of scores, the median is the score
- If there is an even number of scores, the median is the average of the score and the score
Worked Example: Calculating the Median
The temperature readings of a sick child (in degrees Celsius) are:
a) Sort the data in ascending order
b) Calculate the median
Step 1: Count the number of scores.
(there are 6 temperature readings)
Step 2: Since there is an even number of scores, we need to find the average of the two middle values.
The position of the first middle score is:
This is the 3rd score, which is .
The position of the second middle score is:
This is the 4th score, which is .
Step 3: Find the average of these two middle scores.
Answer: The median temperature is 38.5°C
Mode
The mode is the value that appears most frequently in a dataset. It's the score with the highest frequency.
When is the mode useful?
The mode is particularly helpful for:
- Categorical data: Data types that don't allow numerical calculations, such as colours, brands, or categories
- Finding the most common value: When you want to know what value occurs most often
Important points about the mode
Multiple modes: A dataset can have more than one mode. If there are two modes, the data is called bimodal. If there are more than two modes, the data is called multimodal.
Modal class: When data is grouped into class intervals, we cannot identify an exact mode. Instead, we identify the modal class – this is the class interval with the highest frequency.
Limitations of the Mode
The mode may appear at the beginning or end of a data range, which means conclusions based only on the mode might not accurately represent the entire dataset. It's often best to consider all three measures of central tendency together for a complete picture of your data.
How to find the mode
Step 1: Count how many times each score occurs in the dataset.
Step 2: Identify which score occurs the most number of times. This is the mode.
Step 3: If two or more scores occur equally often and more than any other scores, they are all considered modes.
Remember About the Mode
The mode is the value itself, not its frequency. For example, if the score 5 appears 8 times and this is the highest frequency, the mode is 5, not 8.
Exam Tips
Exam Success Strategies
- Always show your working when calculating measures of central tendency
- For grouped data, remember that the mean is an approximation
- Check whether the question asks for population mean () or sample mean ()
- When finding the median, make sure you arrange the data in order first
- Remember that the mode is the value itself, not its frequency
- Consider which measure is most appropriate for the type of data you have
Remember!
Key Points to Remember
- Mean is the average found by adding all values and dividing by the count. For grouped data, use class centres and the formula
- Median is the middle value when data is ordered. For even numbers of scores, average the two middle values
- Mode is the most frequently occurring value. Datasets can be bimodal (two modes) or multimodal (more than two modes)
- Use for population mean and for sample mean
- The mean from grouped data is an approximation, not an exact value