Frequency Tables & Mean, Median, and Mode (HSC SSCE Mathematics Standard): Revision Notes
Frequency Tables & Mean, Median, and Mode
What is a frequency table?
A frequency table is a systematic way to organise data. It displays each unique score or outcome in your dataset alongside how many times that score appears. This type of table is also known as a frequency distribution.
A frequency table typically consists of three columns:
- Score column: Lists all the different scores or outcomes in ascending order (from smallest to largest)
- Tally column: Records the count using tally marks, which are grouped in sets of five for easy counting
- Frequency column: Shows the final count of how many times each score occurred
The tally column helps you keep track as you count through your data. However, if you're given a frequency table that has already been created, the tally column might be omitted.
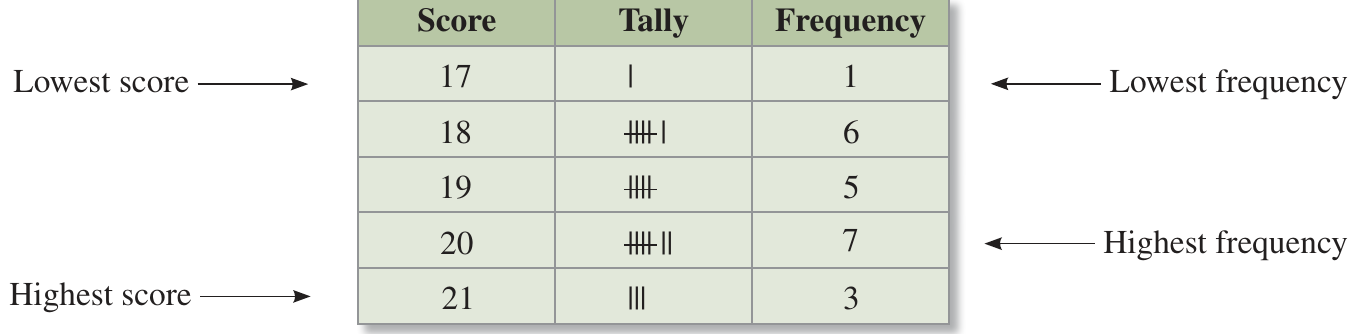
In the example above, you can see how the table clearly identifies:
- The lowest score (17) and highest score (21) in the dataset
- The lowest frequency (1 occurrence) and highest frequency (7 occurrences)
- How tally marks are grouped in fives with a diagonal line through each group
The tally column is a helpful counting tool when constructing a frequency table from raw data, but it's often omitted in final presentations or when the table is already complete. The most important columns are the score and frequency columns.
How to construct a frequency table
Building a frequency table from raw data is straightforward when you follow these steps:
- Draw a table with three columns labelled "Score", "Tally", and "Frequency"
- In the score column, list all the unique values from your dataset in ascending order, starting with the lowest and ending with the highest
- Go through your data one value at a time, making a tally mark in the appropriate row each time you encounter that score. Remember to group your tally marks in fives
- Count the tally marks for each score and record the total in the frequency column
- Add up all the values in the frequency column. This total should match the number of data points in your original dataset - this is a useful way to check your work
Worked Example: Constructing a Temperature Frequency Table
Suppose you have temperature readings for 39 days:
19, 20, 18, 23, 27, 25, 26, 27, 28, 27, 25, 24, 24, 19, 25, 22, 21, 28, 26, 26, 22, 20, 25, 20, 22, 24, 24, 22, 21, 24, 25, 26, 25, 27, 21, 23, 23, 22, 25
Let's construct a frequency table step by step:
Step 1: Identify the range: the lowest temperature is 18°C and the highest is 28°C.
Step 2: Create your table structure and list all temperatures from 18 to 28 in the score column.
Step 3: Go through the data systematically, making a tally mark for each occurrence.
Step 4: Count your tally marks and record the frequencies.
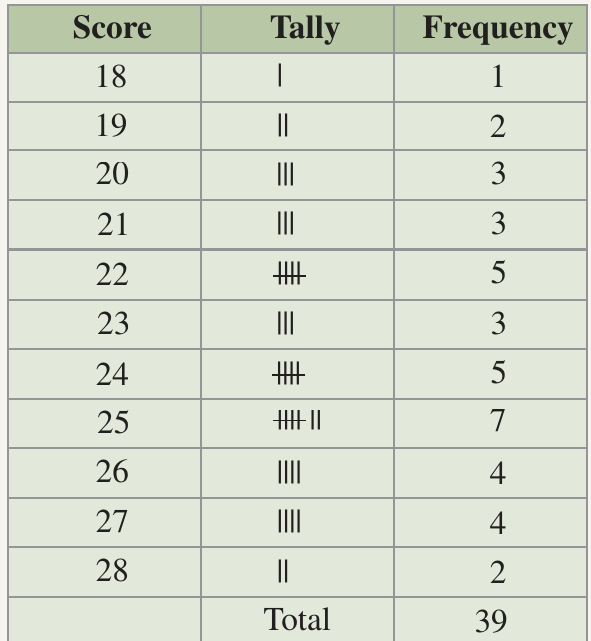
Check: Notice how the total frequency is 39, which matches the number of temperature readings we started with. This confirms our frequency table is correct.
Always verify your frequency table by adding up all the frequencies. If the total doesn't equal the number of data points you started with, you've made an error and need to recheck your work.
Understanding measures of central tendency
When you have a dataset, you often want to describe it using a single value that represents the centre or "typical" value of the data. Three common measures help us do this: the mean, median, and mode. Each measure gives us different information about our data.
Mean
The mean represents the arithmetic average of your dataset. It's calculated by adding all the scores together and dividing by the number of scores you have.
The formula for the mean is:
Where:
- (read as "x bar") represents the mean
- means the sum of all the scores
- is the total number of scores
The mean is what most people refer to when they talk about "the average". For example, if you have the scores 1, 6, 3, and 2, you would calculate:
The mean is particularly useful because it takes into account every value in your dataset. However, it can be affected by extreme values (outliers).
The mean is sensitive to extreme values or outliers in your data. A single very large or very small value can significantly shift the mean, which is why it's important to consider all three measures of central tendency when analysing data.
Median
The median is the middle value in your dataset when all the scores are arranged in order from smallest to largest. It divides your data in half - 50% of the scores are below the median and 50% are above it.
To find the median:
- Arrange all scores in ascending order (from smallest to largest)
- If you have an odd number of scores, the median is simply the middle valueFor example: In the dataset 1, 4, 5, 7, 8, the median is 5
- If you have an even number of scores, the median is the average of the two middle valuesFor example: In the dataset 1, 1, 4, 5, 7, 8, there are two middle values (4 and 5)The median is
The median is less affected by extreme values than the mean, making it useful when your data contains outliers.
Remember the two cases for finding the median:
- Odd number of scores: The median is the single middle value
- Even number of scores: The median is the average of the two middle values
Always arrange your data in order first before attempting to find the median!
Mode
The mode is the score that appears most frequently in your dataset. In a frequency table, it's the score with the highest frequency.
To find the mode:
- Count how many times each score occurs (or look at the frequency column in a frequency table)
- The score that occurs most often is the mode
The mode is particularly useful for categorical data where you can't perform numerical calculations. For example, if you're collecting data about favourite colours, the mode tells you which colour was chosen most often.
Note that a dataset can have more than one mode if multiple scores appear with the same highest frequency. Modes can occur at any position in the range of values - at the beginning, middle, or end.
Unlike the mean and median, the mode is especially valuable when working with categorical data (such as colours, brands, or preferences) where calculating an average doesn't make sense. It simply tells you what occurs most often.
Worked example: Calculating mean, median, and mode
Let's work through a complete example that brings together all three measures.
The table below shows the number of rainy days for the first six months of the year:

Worked Example: Finding Mean, Median, and Mode
We need to find the mean, median, and mode for this data.
Finding the mean:
Using the formula
Add all the scores together:
Calculate the sum:
Therefore, the mean is 11 rainy days.
Finding the median:
First, arrange the scores in ascending order:
8, 8, 10, 12, 13, 15
We have 6 scores (an even number), so the median is the average of the 3rd and 4th scores.
The 3rd score is 10 and the 4th score is 12.
Therefore, the median is 11 rainy days.
Finding the mode:
Looking at our ordered data: 8, 8, 10, 12, 13, 15
The score 8 appears twice, while all other scores appear only once.
Therefore, the mode is 8 rainy days.
Interpretation: In this example, notice how the mean and median are the same (11), but the mode is different (8). This shows us that while the "average" and "middle" number of rainy days is 11, the most frequently occurring value was 8 rainy days.
Key Points to Remember:
- A frequency table organises data into three columns: score (in ascending order), tally marks (grouped in fives), and frequency (the final count)
- Always check your work by adding up the frequency column - it should equal your total number of data points
- The mean is the arithmetic average: add all scores and divide by the number of scores ()
- The median is the middle value when scores are arranged in order. For an even number of scores, average the two middle values
- The mode is the most frequently occurring score - the one with the highest frequency
- Each measure of central tendency gives you different information about your data, and each has its own advantages depending on the situation