Relative and Expected Frequency (HSC SSCE Mathematics Standard): Revision Notes
Relative and Expected Frequency
Relative frequency and expected frequency are important concepts that help us understand probability through experiments and predictions. This note will help you learn how to calculate and use these measures in practical situations.
What is relative frequency?
Relative frequency is a way of estimating probability based on actual experimental results. When you conduct an experiment, the frequency of an event is simply how many times that event happens. The relative frequency takes this a step further by comparing the frequency to the total number of trials.
Think of relative frequency as experimental probability because it estimates the chances of something happening based on what you've observed. You can express relative frequency as a fraction, decimal, or percentage.
Relative frequency can be expressed in three different ways:
- As a fraction (e.g., )
- As a decimal (e.g., )
- As a percentage (e.g., )
Choose the format that best suits the question or context you're working with.
Formula for relative frequency
The formula for calculating relative frequency is straightforward:
Where:
- = frequency of the event
- = total number of trials
Relative frequency gives us an estimate for the probability of an event occurring.
Worked Example: Finding Relative Frequency
Let's look at an experiment where two coins are tossed repeatedly, and we record the number of heads that appear.
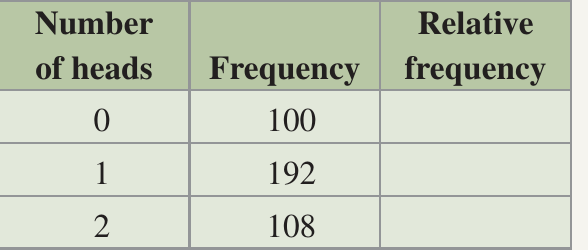
Question: Find the relative frequency of obtaining 0 heads, 1 head, and 2 heads.
Solution:
First, we need to find the total number of trials:
- Total
For 0 heads:
- Apply the formula:
- Substitute values:
- Simplify:
- Answer: The relative frequency of getting 0 heads is or
For 1 head:
- Apply the formula:
- Substitute values:
- Simplify:
- Answer: The relative frequency of getting 1 head is or
For 2 heads:
- Apply the formula:
- Substitute values:
- Simplify:
- Answer: The relative frequency of getting 2 heads is or
What is a simulation?
A simulation is a mathematical model that represents a real experiment or situation. Instead of conducting the actual experiment (which might be expensive, time-consuming, or impractical), we can use simulations to predict outcomes.
Simulations can involve various tools:
- Calculators or computers
- Coins or dice
- Playing cards
- Random number tables
Simulations are particularly useful when the real experiment would be too costly or take too long to perform. For example, rather than waiting an entire cricket season to see match results, we can simulate the season using probability. This allows us to make predictions and test strategies without the time and expense of real trials.
Worked Example: Performing a Simulation
Let's simulate the results of 50 cricket matches in a season, where there are three possible outcomes for each match.

Given information:
- Probability of winning a match:
- Probability of drawing a match:
- Probability of losing a match:
Task: Use 10 playing cards (numbered 1 to 10) to simulate 50 matches and record the results.
Solution:
First, we assign cards to each outcome based on their probabilities:
- Win: of 10 cards cards → Assign cards 1, 2, and 3 to "Win"
- Draw: of 10 cards cards → Assign cards 4, 5, 6, 7, and 8 to "Draw"
- Lose: of 10 cards cards → Assign cards 9 and 10 to "Lose"
Then, we conduct the simulation:
- Select a card at random
- Record the result
- Replace the card
- Repeat 50 times
Here are the results in a frequency table with relative frequencies:
| Score | Frequency | Relative frequency |
|---|---|---|
| Win (1, 2, 3) | 13 | |
| Draw (4, 5, 6, 7, 8) | 27 | |
| Lose (9, 10) | 10 | |
| Total | 50 | 1 |
Exam tip: When performing simulations, always ensure your card assignments match the given probabilities and that you replace the card after each selection to maintain consistent probabilities throughout the simulation.
What is expected frequency?
While relative frequency tells us what actually happened in an experiment, expected frequency tells us what we predict should happen based on probability theory. It's the number of times we expect a particular event to occur.
For example, when tossing a fair coin, the probability of getting heads is . If we toss the coin 100 times, we would expect about 50 heads (calculated as ).
The Law of Large Numbers
The expected frequency may not match the actual results exactly. However, the larger the number of trials, the closer the actual results should be to the expected frequency. This is known as the law of large numbers.
This means that if you flip a coin 10 times, you might get 6 heads and 4 tails, but if you flip it 10,000 times, the results will be much closer to the expected 5,000 heads and 5,000 tails.
Formula for expected frequency
The formula for expected frequency is:
Where:
- = number of times the experiment is repeated
- = probability of the event
Worked Example: Finding Expected Frequency
Two coins are tossed 120 times and the results are recorded.
Question a: What is the expected frequency for two heads?
Solution:
- First, find the probability of getting two heads
- Possible outcomes when tossing two coins: HH, HT, TH, TT (4 outcomes)
- Favourable outcomes for two heads: HH (1 outcome)
- Probability:
- Apply the expected frequency formula:
- Substitute:
- Calculate:
- Answer: The expected frequency for two heads is 30
Question b: What is the expected frequency for a head and a tail?
Solution:
- Find the probability of getting one head and one tail
- Favourable outcomes: HT and TH (2 outcomes)
- Total outcomes: 4
- Probability:
- Apply the formula:
- Substitute:
- Calculate:
- Answer: The expected frequency for one head and one tail is 60
Understanding non-whole number expected frequencies
Expected frequency doesn't always give us a whole number, and that's perfectly fine. It's an estimate, not an exact prediction.
For example, when rolling a die, the probability of getting a six is . If we roll the die 100 times:
Obviously, you can't get two-thirds of an outcome in reality. However, this tells us to expect approximately 16 or 17 sixes in 100 rolls. The expected frequency gives us a target value that the actual results should be close to.
Exam tip: When your expected frequency calculation gives a non-whole number, keep it as is. Don't round it unless the question specifically asks you to. The decimal or fraction represents the theoretical expectation.
Key Points to Remember:
-
Relative frequency is calculated from experimental data using , where is the frequency and is the total number of trials. It estimates probability based on what actually happened.
-
Simulations are mathematical models that help us predict outcomes without conducting expensive or time-consuming real experiments. They use tools like cards, dice, or computers.
-
Expected frequency is calculated using , where is the number of trials and is the probability. It predicts what should happen based on probability theory.
-
The law of large numbers states that as the number of trials increases, relative frequency gets closer to the actual probability, and actual results get closer to expected frequency.
-
Expected frequency may not be a whole number, and actual experimental results rarely match expected frequency exactly. Both are estimates and predictions, not guarantees.