Analysing the Photoelectric Effect (HSC SSCE Physics): Revision Notes
Analysing the Photoelectric Effect
Einstein's model of the photoelectric effect
In 1905, Einstein developed a groundbreaking explanation for the photoelectric effect by combining two fundamental concepts: conservation of energy and Max Planck's idea of quantisation. This model successfully explained experimental observations that classical physics could not account for.
Einstein proposed that electromagnetic radiation (light) behaves as if it is quantised when interacting with matter. Rather than acting as a continuous wave, light delivers its energy in discrete packets. Each quantum of light carries an energy determined by the relationship , where is Planck's constant and represents the frequency of the radiation.
Einstein's quantum explanation of the photoelectric effect was revolutionary because it challenged the classical wave theory of light. This work contributed to Einstein receiving the Nobel Prize in Physics in 1921, not for his theory of relativity, but for this explanation of the photoelectric effect.
Conservation of energy in the photoelectric effect
When a photon strikes a metal surface, an electron within the metal can absorb all of the photon's energy. However, for the electron to escape from the metal surface, it must overcome an energy barrier. This required energy is called the work function and represents the minimum energy needed to remove an electron from the metal.
The work function
The work function () is characteristic of each metal and depends on how tightly electrons are bound within that particular material. It is related to the cut-off frequency by:
where:
- is the work function (measured in joules or electron-volts)
- is Planck's constant ( Js or eVs)
- is the cut-off frequency (the minimum frequency needed to cause photoemission)
The work function is effectively an ionisation energy for the metal as a whole. Unlike ionisation of individual atoms, the photoelectric effect involves removing electrons from the entire metal lattice structure. This is why different metals have different work functions - their atomic structures bind electrons with varying strength.
The photoelectric equation
Einstein's photoelectric equation combines the energy gained from absorbing a photon with the energy cost of leaving the metal:
This equation tells us that:
- An electron absorbs photon energy
- To escape the metal, the electron must use energy (the work function)
- The remaining energy becomes the electron's kinetic energy
- The maximum possible kinetic energy is
Photoemission only occurs when the photon frequency exceeds the cut-off frequency (). Below this frequency, no photoelectrons are emitted regardless of the light's intensity. This is a key prediction of Einstein's model that classical wave theory could not explain.
Work functions of common metals
Different metals have different work functions because their atomic structures bind electrons with varying strength. The table below shows typical work function values for several common metals:
| Metal | (eV) | (J) |
|---|---|---|
| Na | 2.46 | |
| Al | 4.08 | |
| Fe | 4.50 | |
| Cu | 4.70 | |
| Zn | 4.31 | |
| Ag | 4.73 | |
| Pt | 6.35 | |
| Pb | 4.14 |
These values can vary depending on whether the metal is a single crystal or polycrystalline. For single crystals, the work function also depends on which crystal face is illuminated. Notice that sodium (Na) has the lowest work function, making it easiest to liberate electrons, while platinum (Pt) has the highest work function among these common metals.
Graphical analysis of the photoelectric effect
When we plot the maximum kinetic energy of photoelectrons () against the frequency of incident light (), we obtain a straight line. This graphical representation provides a powerful way to determine both Planck's constant and the work function of the metal being studied.
The photoelectric equation has the form of a straight line equation , where:
- The gradient (slope) equals Planck's constant,
- The y-intercept equals the negative of the work function,
- The x-intercept gives the cut-off frequency,
Worked example: Finding the work function from a graph
Worked Example: Finding the Work Function from a Graph
The graph below shows experimental data for caesium. We can use this to determine the work function.
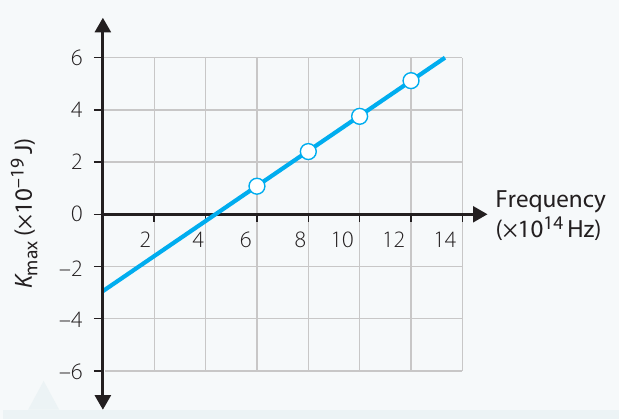
Solution:
| Answer | Logic |
|---|---|
| Hz | Identify the cut-off frequency from where the line crosses the x-axis |
| The work function relates to the cut-off frequency | |
| Js Hz | Substitute the values with correct units |
| J | Calculate the answer with appropriate significant figures |
| eV | Convert from joules to electron-volts |
The work function of caesium is therefore 1.8 eV or 2.9 × 10⁻¹⁹ J.
Millikan's experimental verification
Robert Millikan initially doubted Einstein's quantum explanation of the photoelectric effect. However, his commitment to rigorous experimentation led him to spend ten years developing increasingly precise apparatus to test Einstein's model.
Millikan made crucial improvements to the photoelectric experiment:
- He developed techniques to clean metal surfaces thoroughly
- He assembled the apparatus in vacuum conditions to prevent contamination
- He ensured surfaces remained pure enough for accurate measurements
His careful experiments produced graphs similar to those predicted by Einstein's theory. Most significantly, Millikan found that the gradient of these graphs consistently matched Planck's constant (within experimental uncertainty). Eventually, he concluded that Einstein's model correctly explained the experimental data and that no other existing theory could do so.
Millikan later wrote in his autobiography that his data "scarcely permits of any other interpretation than that which Einstein had originally suggested". This represents one of the most important experimental confirmations in the development of quantum theory. Ironically, Millikan's meticulous attempts to disprove Einstein's theory ended up providing its strongest experimental support.
Understanding the energy distribution of photoelectrons
The photoelectric equation gives us the maximum kinetic energy of emitted electrons. However, photoelectrons are actually emitted with a continuous range of energies from zero up to this maximum value. Understanding why this occurs requires examining what happens inside the metal.
Conduction electrons
Metals contain many conduction electrons that are free to move throughout the material. These electrons are not bound to any particular atom. When a conduction electron absorbs a photon, it gains energy .
To escape from the metal surface, an electron must:
- Have absorbed enough energy from a photon (minimum energy )
- Reach the surface
- Overcome the surface energy barrier
Why electrons have different kinetic energies
Electrons at the very surface that absorb a photon and escape immediately, without any energy losses, will have the maximum kinetic energy: .
However, most electrons lose some of their absorbed energy through:
- Collisions with other electrons
- Interactions with atomic nuclei in the metal lattice
- Internal energy losses as they travel through the metal
Some electrons lose all their energy and never escape at all. This lost energy appears as increased temperature of the metal.
The result is a continuous spectrum of photoelectron energies ranging from zero (electrons that barely escape) up to the maximum value of (electrons that escape with no energy losses).
Worked example: Calculating photoelectron energies
Worked Example: Calculating Photoelectron Energies
Ultraviolet light with wavelength nm strikes a polished silver plate. The work function for silver is eV.
a) What is the kinetic energy of the fastest moving electrons?
b) What is the kinetic energy of the slowest moving electrons?
c) What is the cut-off frequency for silver?
Solution:
| Answer | Logic |
|---|---|
| nm, eV | Identify the given data |
| a) | Use the photoelectric equation |
| Relate frequency to wavelength | |
| Substitute the expression for frequency | |
| eV | Substitute values (using in eVs since is in eV) |
| eV | Calculate the final answer |
| b) eV | The slowest electrons only just escape with zero kinetic energy |
| c) | Relate the cut-off frequency to the work function |
| Rearrange for cut-off frequency | |
| Substitute values with correct units | |
| Hz | Calculate the final answer |
Answers:
- a) Maximum kinetic energy: 1.5 eV
- b) Minimum kinetic energy: 0 eV
- c) Cut-off frequency: 1.1 × 10¹⁵ Hz
Photons: the quantisation of energy
Einstein's explanation gave physical meaning to the concept of quantised energy. Light doesn't just behave as a continuous wave—under certain circumstances, it acts as discrete particles. These particles of light are called photons.
Properties of photons
Photons have several important characteristics:
- They have zero rest mass (they cannot be at rest)
- They travel at the speed of light,
- Their energy is given by , where is the frequency
- They possess momentum, calculated using (where is momentum)
The term "photon" was introduced by chemist Gilbert Lewis in 1926. Further experiments by Arthur Holly Compton provided additional evidence for photons as particles. Compton scattered individual photons from electrons and observed that only specific energies were absorbed, confirming the quantum nature of light.
Worked example: Energy range of visible spectrum photons
Worked Example: Energy Range of Visible Spectrum Photons
The visible spectrum ranges from blue light (wavelength approximately nm) to red light (wavelength approximately nm). Let's find the energy range of visible photons.
Solution:
| Answer | Logic |
|---|---|
| Relate photon energy to frequency | |
| Relate frequency to wavelength | |
| Substitute the expression for frequency | |
| Highest energy corresponds to shortest wavelength | |
| Substitute values with correct units | |
| eV | Calculate the answer |
| Lowest energy corresponds to longest wavelength | |
| Substitute values with correct units | |
| eV | Calculate the answer |
Visible light photons have energies ranging from 1.8 eV (red) to 3.1 eV (blue).
Investigation 11.2: Observing the photoelectric effect
This investigation allows you to observe the photoelectric effect using simple laboratory equipment.
Aim
To observe the photoelectric effect experimentally.
Materials
- Electroscope (commercial or homemade)
- Polished zinc plate
- Steel wool or fine sandpaper
- Glass rod
- Polythene rod
- Fur or wool fabric
- Ultraviolet light source
- Other light sources (e.g., lasers, torches)
- Stopwatch
Risk assessment
| What are the risks in doing this investigation? | How can you manage these risks to stay safe? |
|---|---|
| Ultraviolet light can damage your eyes. | Do not look directly at the ultraviolet light source. Turn it off when not in use. |
Consider what other risks might be associated with your investigation and how to manage them safely. Always conduct a thorough risk assessment before beginning any practical work.
Method
- Clean the zinc plate thoroughly with steel wool or sandpaper. Place it on the electroscope without leaving fingerprints on the cleaned surface.
- Charge the glass rod by rubbing it vigorously with fur or wool.
- Touch the charged rod to the zinc plate. The electroscope leaves should separate, showing the plate is charged.
- Time how long the leaves take to fall back together. If this exceeds two minutes, record "more than two minutes" and discharge the electroscope by touching it with your hand (avoiding the zinc plate).
- Repeat steps 2-4, but this time shine one of your light sources onto the plate while timing.
- Repeat step 5 with each different light source.
- Charge the polythene rod by rubbing it vigorously with fur or wool fabric.
- Use the rod to charge the electroscope (the plate will now have opposite charge to before).
- Time how long the leaves take to fall back together.
- Repeat steps 7-9, shining each light source on the zinc plate while timing.
- Charge the zinc plate with the polythene rod, then shine the ultraviolet light on it from various distances. This varies the intensity of light reaching the plate.
Key Observation: The glass rod becomes positively charged (so the plate is positively charged). The polythene rod becomes negatively charged (so the plate is negatively charged). This difference is crucial for understanding which charge carriers are being removed by the photoelectric effect.
Results
- Draw a labelled diagram showing your experimental setup.
- Record your results in a table like the one below. Note: The glass rod becomes positively charged (so the plate is positively charged). The polythene rod becomes negatively charged (so the plate is negatively charged).
| Charge on plate | Light used | Time to discharge (s) |
|---|---|---|
- Include units and uncertainties in your data.
- If you measured discharge time at various distances (step 11), record results in this table:
| Distance to light (m) | Time to discharge (s) |
|---|---|
Analysis of results
- Explain what is happening in each case you investigated.
- Plot a graph of time to discharge versus distance to light using data from your second table. Consider whether you expect this graph to be linear. What shape should it have? Can you verify this?
Discussion
- Discuss whether your graph shapes match expectations. If not, consider why this might be and examine any assumptions you made.
- What could you do to improve the accuracy and precision of this experiment?
- How might you extend the method to investigate another aspect of the photoelectric effect?
Conclusion
Write a conclusion based on your results and analysis, relating your observations to the theory of the photoelectric effect.
Summary
Key Points to Remember:
-
Einstein explained the photoelectric effect by combining conservation of energy with Planck's quantisation concept. Light behaves as if it consists of discrete energy packets (photons) when interacting with matter.
-
The photoelectric equation is , where is the maximum kinetic energy of photoelectrons, is the photon energy, and is the work function.
-
Graphs of maximum kinetic energy versus frequency are straight lines with gradient equal to Planck's constant and y-intercept equal to the negative work function.
-
Photoelectrons have a continuous range of energies from zero to because most electrons lose some energy in collisions before escaping the metal.
-
Photons are particles with zero rest mass and energy . They also possess momentum given by .