How to Design and Conduct a Scientific Investigation (Unit 1) (VCE SSCE Biology): Revision Notes
How to Design and Conduct a Scientific Investigation (Unit 1)
Overview of scientific investigations
As part of Unit 1 assessment, you will design and conduct your own scientific investigation related to cell function and/or regulation of biological systems. This investigation demonstrates your ability to plan experiments, generate data, and draw evidence-based conclusions.
A successful investigation requires:
- Generation of primary quantitative and/or qualitative data
- Thorough analysis and evaluation of collected data
- Identification of limitations in both data and methodology
- Discussion linking results to broader scientific concepts
- A clear conclusion addressing the research question
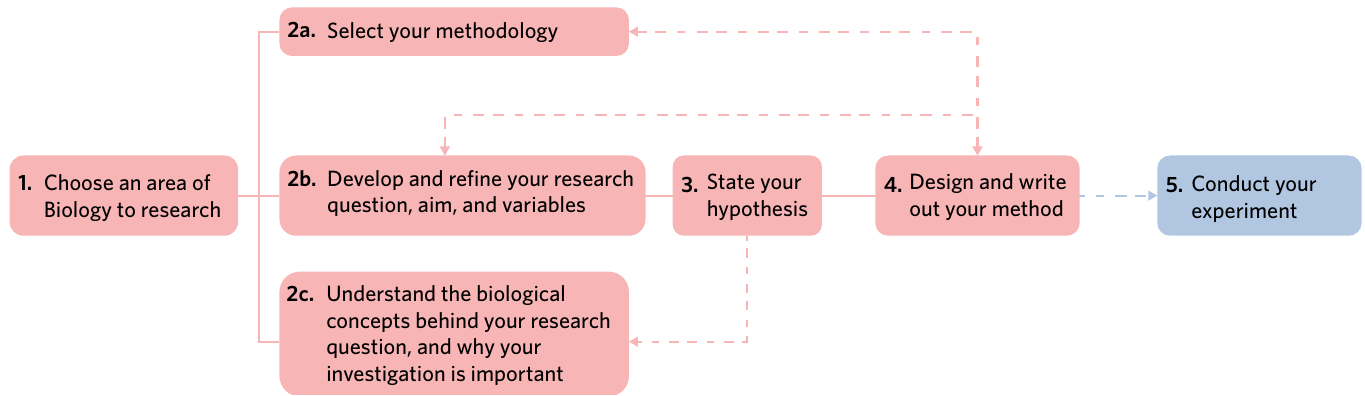
The investigation process follows three key stages that mirror the scientific method. Each stage builds upon the previous one, creating a comprehensive approach to scientific inquiry that develops your skills as a scientific researcher.
The three stages of investigation
The investigation process is divided into three interconnected stages:
Stage 1: Investigation design - Planning and preparing your experiment, including developing your research question, understanding relevant theory, and designing your methodology.
Stage 2: Scientific evidence - Conducting your experiment and collecting data using systematic approaches and maintaining proper documentation.
Stage 3: Scientific communication - Presenting your findings in a structured scientific report that clearly communicates your process, results, and conclusions.
Stage 1: Investigation design
Step 1: Developing a research question
Your research question forms the foundation of your entire investigation. It must relate to concepts from Unit 1, specifically the function and/or regulation of cells and systems.
Characteristics of good research questions:
- Testable - can be investigated through practical experimentation
- Achievable - realistic within available time, resources, and equipment
- Specific - clearly defined and focused on a particular aspect
Potential topic areas include:
- Homeostatic regulation mechanisms
- Apoptosis and cell death processes
- Cell cycle differences (prokaryotic versus eukaryotic)
- Semi-permeability of plasma membranes
- Structure and function of biological systems
- How cell size and shape contribute to function
Research Question Example: Plant Growth Investigation
The example used throughout this guide investigates: "Does the growth of an indoor mini fiddle-leaf fig (Ficus lyrata bambino) increase when exposed to more sunlight?"
This question arose from observing that office plants near windows grew better than those further away. The question is:
- Testable - can measure plant growth
- Achievable - requires basic materials
- Specific - focuses on one plant species and one environmental factor
Step 2: Understanding biological concepts
Before designing your experiment, you must clearly understand the biological theory underlying your research question. This serves two purposes:
For you: Clarifies what you're investigating and helps you design appropriate methods and analyse results effectively.
For your reader: Provides necessary background information to understand your investigation's significance and approach.
Your introduction should define key terms and explain the most important concepts. For instance, if investigating homeostasis, you would explain what homeostasis is, why it matters, how it normally functions, and what factors influence it.
Biological Concepts: Plant Growth Investigation
For the plant growth investigation, the key concept is photosynthesis. Plant cells obtain glucose for cellular respiration through photosynthesis, where light energy transforms carbon dioxide and water into glucose and oxygen:
Since photosynthesis requires light, plants exposed to more sunlight can produce more glucose, potentially leading to increased growth. Understanding this relationship explains why sunlight exposure might affect plant height.
Step 3: Selecting methodology and defining variables
Choosing your methodology
Select the most appropriate scientific approach for answering your research question. Options include:
- Controlled experiment
- Correlational study
- Fieldwork
- Modelling
- Process or system development
- Simulation
For most Unit 1 investigations, a controlled experiment is most suitable. This methodology examines how changing one variable (independent variable) affects another (dependent variable) whilst keeping all other factors constant (controlled variables).
Defining your variables
Clear variable definition is essential for controlled experiments:
Independent variable (IV): The factor you deliberately change or manipulate. This is what you're testing.
Dependent variable (DV): The factor you measure or observe. This is what responds to changes in the independent variable.
Controlled variables: All other factors that must remain constant throughout the experiment to ensure fair testing.
Always specify the units of measurement for each variable. This precision is crucial for reproducibility and clear communication.
Variable Definition: Plant Growth Investigation
For the plant growth investigation:
- Independent variable: Amount of sunlight exposure (measured as: no light, 10 metres from window, direct sunlight)
- Dependent variable: Plant growth (measured as height in millimetres)
- Controlled variables: Water amount, watering frequency, fertiliser use, soil quality, temperature, plant species, initial plant size and health
Step 4: Stating your hypothesis
Hypothesis: A testable statement predicting how the independent variable will affect the dependent variable.
Your hypothesis should be based on your understanding of relevant biological theory and any background research you've conducted. After completing your experiment, your results will either support or refute this prediction.
A good hypothesis is:
- Specific and clear
- Testable through your methodology
- Based on scientific reasoning
- Written as a definite statement (not a question)
Hypothesis: Plant Growth Investigation
"The growth of a mini fiddle-leaf fig will increase when exposed to more sunlight."
This hypothesis predicts a positive relationship between sunlight exposure and plant growth, based on understanding of photosynthesis.
Step 5: Designing your experiment
Once you've selected your methodology, design the specific steps of your investigation. For controlled experiments, address these key components:
1. Measurement approach
- What will you measure and how?
- What instruments will you use?
- How long will the experiment run?
- What sample size will you use?
2. Experimental groups
- What different conditions will you test?
- How will you create these conditions?
- Will you include a control group?
3. Controlled variables
- What factors must remain constant?
- How will you ensure they don't vary?
4. Replication
- How many replicates will you have?
- Why is this number appropriate?
5. Error minimisation
- What potential errors might occur?
- How will you prevent or minimise them?
6. Sample selection
- How will you select your sample?
- Is your selection method appropriate and unbiased?
7. Safety and ethics
- What safety precautions are necessary?
- Are there ethical considerations?
- What personal protective equipment (PPE) is required?
Experimental Design: Plant Growth Investigation
Materials needed: 15 healthy Ficus lyrata bambino plants, tape measure with millimetre markings, gloves, safety goggles, cupboard, watering jug.
Methodology:
- Randomly select 15 Ficus lyrata bambino plants of similar height and size
- Divide plants into three groups (A, B, C) with five plants each. Assign each plant a number (A1-A5, B1-B5, C1-C5)
- Measure initial height from soil level to stem tip using tape measure. Wear gloves to protect from plant sap
- Water each plant with 20 mL tap water
- Place Group A plants in closed cupboard (no light), Group B plants on table 10 metres from north-facing window, Group C plants directly in front of same window
- After two weeks, have the same person measure and record all plant heights again
Design strengths:
- Replication - five plants per group
- Controls variables - same watering, no fertiliser, same species
- Minimises errors - same person measuring, same equipment
- Considers safety - gloves and goggles for sap protection
Step 6: Considering internal measures
Before and after conducting your investigation, evaluate how well it satisfies important quality measures. Understanding these concepts helps you design better experiments and critically evaluate your results.
Accuracy: How close your results are to the true value of what you're measuring. For example, if the optimal photosynthesis temperature for a plant is known to be 35°C, accurate results would be close to this value.
Precision: How close your results are to each other across repeated measurements. High precision means replicate measurements give similar values, indicating a reliable method. Low precision shows wide variation between replicates.
Reproducibility: Whether other scientists could follow your method and obtain the same results. High reproducibility means your experiment is well-documented and your findings are reliable.
Repeatability: Whether you could personally repeat the experiment and get the same results. This indicates consistency in your experimental technique.
Validity: Whether your experiment actually measures what it claims to measure. A valid experiment directly addresses the research question without confounding factors.
These measures are interconnected. An investigation can be precise but not accurate (consistent results that are all wrong), or accurate but not precise (results cluster around the true value but vary widely). The ideal investigation is both accurate and precise.
Stage 2: Scientific evidence
Step 1: Establishing a logbook
A logbook is essential for recording all aspects of your investigation as it progresses. This reflects standard scientific practice and serves multiple purposes:
Documentation: Records all observations, measurements, and procedures as they occur.
Authentication: Provides evidence that you personally conducted the investigation.
Reflection: Allows you to track your thinking and decision-making process.
Assessment: Required for satisfactory completion of VCE Biology units.
Your logbook should include:
- Dated entries for all activities
- Clear documentation of procedures
- All raw data and observations
- Any unusual occurrences or problems
- Thoughts about results and next steps
- References to sources used
The logbook can be maintained as a hard copy (recommended to prevent falsification) or electronic form. All entries must be dated and clearly documented. Your teacher should regularly sight and monitor your logbook.
Step 2: Collecting your data
Types of data
You must generate primary data - information you collect directly through your own investigation. This can be:
Quantitative data: Numerical measurements involving counts, units, and quantities. Examples include plant height in millimetres, temperature in degrees Celsius, or number of cells.
Qualitative data: Descriptive observations involving qualities and characteristics. Examples include colour changes, written descriptions of behaviour, or interview responses.
For VCE Biology Unit 1 investigations, you should generate quantitative and/or qualitative primary data. Be prepared to explain why you chose your particular data type and how it addresses your research question.
Recording data
Record all results in your logbook as you collect them, even if they seem unusual or unexpected. Also note:
- Any deviations from planned procedure
- Unusual observations
- Equipment malfunctions
- Environmental conditions
- Anything that might affect results
This complete record helps you later identify potential sources of error and evaluate the reliability of your findings.
Data Collection: Plant Growth Investigation
Heights were measured for each plant at the start and after two weeks:
| Plant | Initial height (mm) | 2-week height (mm) |
|---|---|---|
| A1 | 210 | 212 |
| A2 | 214 | 217 |
| A3 | 204 | 205 |
| A4 | 212 | 212 |
| A5 | 202 | 206 |
| B1 | 220 | 231 |
| B2 | 210 | 219 |
| B3 | 213 | 224 |
| B4 | 208 | 221 |
| B5 | 211 | 222 |
| C1 | 222 | 229 |
| C2 | 214 | 234 |
| C3 | 207 | 226 |
| C4 | 215 | 235 |
| C5 | 217 | 240 |
Observations: During initial measurement, plant C1 was knocked over and fell from its pot. It was immediately replanted and remained in the experiment.
Stage 3: Scientific communication
Report structure overview
Your final presentation should follow standard scientific report conventions. The structure includes:
| Section | Content |
|---|---|
| Title | The question under investigation |
| Introduction | Explanation of why the investigation matters, relevant biological concepts, clear aim, and hypothesis |
| Method | Summary of methodology and steps, authenticated by logbook entries. Identification of health, safety, and ethical guidelines followed |
| Results | Presentation of data in appropriate formats showing trends, patterns, and relationships |
| Discussion | Analysis of primary data, linking to biological concepts, identification of outliers and their treatment, limitations and improvements |
| Conclusion | Response to the research question based on analysis, with no new information introduced |
| References | Acknowledgement of all quoted and sourced content |
Check with your teacher about specific formatting requirements, such as whether to use personal pronouns or include an abstract.
Title
Your title should clearly state what you investigated. It can be your research question or a rewording of it. Keep it concise and informative.
Example Title:
"Does sunlight affect the growth of Ficus lyrata bambino?"
Abstract (optional)
An abstract provides a brief summary of your entire investigation, typically 150-250 words. It helps readers quickly understand your work. Check with your teacher whether an abstract is required.
Structure your abstract by writing one sentence summarising each main section:
- Why the investigation matters (introduction)
- What you did (method)
- What you found (results)
- What it means (discussion/conclusion)
Example Abstract:
"Office plants improve employee mood, and sunlight affects plant growth. This investigation examined how different amounts of sunlight affect Ficus lyrata bambino, a popular office plant. Three groups of plants were exposed to different light conditions: full sunlight, moderate sunlight, and no sunlight. Plants in full sun grew significantly more over two weeks than the other groups. These results suggest office plant placement should consider available sunlight to ensure optimal growth and maximum benefit to workers."
Introduction
The introduction sets up your investigation by explaining its importance and providing necessary background information.
Components of a good introduction:
1. Explanation for undertaking the investigation
Begin by justifying why your research matters. Why should anyone care about your findings? Link to broader implications or real-world applications.
Connect to previous research where appropriate. This demonstrates that you understand your investigation's place within biology as a whole.
Example Introduction Opening:
"Having indoor plants in office spaces increases employees' mood and perceived comfort whilst reducing stress and sick leave. Understanding the conditions that help office plants flourish is therefore important for workplace wellbeing. The mini fiddle-leaf fig (Ficus lyrata bambino) is a popular office plant native to Africa that is widely used in Australian workplaces."
2. Background biological concepts
Explain the key biological theory relevant to your investigation. Define important terms and describe the processes or systems involved.
Think about what knowledge you used when designing your experiment and forming your hypothesis. Present this information clearly so readers can understand your reasoning.
Example Background Concepts:
"Plant growth depends significantly on photosynthesis. In photosynthesis, plant cells use light energy to transform carbon dioxide and water into glucose, oxygen, and water. The simplified equation is:
Since light is essential for photosynthesis, the amount of sunlight a plant receives directly affects its ability to produce glucose for growth and cellular respiration."
3. Aim and hypothesis
After providing context and background, clearly state your investigation's aim and your hypothesis.
The aim explains what you set out to discover. The hypothesis predicts the relationship you expect to find between your variables.
Write your introduction in present or future tense, as if walking your reader through the investigation process.
Example Aim and Hypothesis:
"This investigation aims to measure the effect of sunlight on the growth of the office plant Ficus lyrata bambino. Given the importance of light in photosynthesis, it is hypothesised that increased sunlight exposure will cause plants to grow more compared to plants exposed to less sunlight or no sunlight."
Method
The method section is like a recipe - it should allow another person to replicate your investigation exactly.
Materials
List everything needed to conduct your experiment. Be specific about equipment specifications (e.g., "tape measure with millimetre markings" rather than just "tape measure").
Example Materials:
"This investigation used 15 healthy Ficus lyrata bambino plants selected randomly from a larger population, a tape measure with millimetre markings, gloves, safety goggles, a cupboard, and a watering jug."
Methodology
Write step-by-step instructions describing exactly what you did. This can be formatted as numbered steps or paragraphs - check your teacher's preference.
Include any safety precautions or ethical considerations you addressed. Mention how you controlled variables and ensured consistent procedures.
Methods are typically written in past tense, though this varies by preference.
Example Methodology:
"The 15 selected plants were randomly allocated into three groups (A, B, C) with five plants each. Each plant was assigned a number within its group (A1-A5, B1-B5, C1-C5). One person measured the height of all plants from soil surface to stem tip using the tape measure. The measurer wore gloves and eye protection at all times because F. lyrata bambino sap is a known skin irritant.
After recording initial heights, each plant received 20 mL of tap water. Group A plants were placed in a cupboard with the door closed, Group B plants on a table 10 metres from a north-facing window, and Group C plants directly in front of the same window.
Plants remained in their positions for two weeks. After two weeks, the same person measured and recorded all plant heights using the same tape measure."
Results
The results section presents your findings without interpretation or explanation. Save analysis for the discussion section.
Transform your data
Don't present raw data - transform it to highlight patterns and trends relevant to your research question.
Choose appropriate formats:
- Line graphs - best for showing how one variable changes in response to another over time or across a range
- Bar graphs - best for comparing categories or groups
- Scatter plots - best for showing relationships between two variables
- Tables - useful for precise values and when showing multiple data types
Remember: typically your x-axis shows the independent variable and your y-axis shows the dependent variable.
Always include:
- Clear titles
- Labelled axes with units
- Figure numbers for reference
- Legends where needed
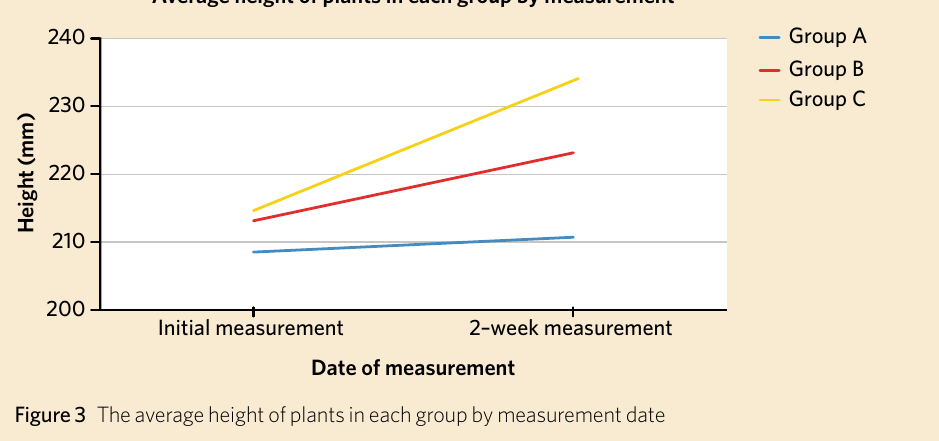
Example Results:
The average initial and two-week heights for each group show clear differences. Group A averaged 208.4 mm initially, increasing to 210.4 mm after two weeks. Group B averaged 212.4 mm initially, increasing to 223.4 mm. Group C averaged 213.25 mm initially, increasing to 233.75 mm.
Calculating percentage growth relative to initial height provides clearer comparison:
| Plant | Initial height (mm) | Average initial height (mm) | 2-week height (mm) | Average 2-week height (mm) | Average percent growth (%) |
|---|---|---|---|---|---|
| A1 | 210 | 208.4 | 212 | 210.4 | 0.96 |
| A2 | 214 | 217 | |||
| A3 | 204 | 205 | |||
| A4 | 212 | 212 | |||
| A5 | 202 | 206 | |||
| B1 | 220 | 212.4 | 231 | 223.4 | 5.18 |
| B2 | 210 | 219 | |||
| B3 | 213 | 224 | |||
| B4 | 208 | 221 | |||
| B5 | 211 | 222 | |||
| C1 | 222 | N/A | 229 | N/A | N/A |
| C2 | 214 | 213.25 | 234 | 233.75 | 9.61 |
| C3 | 207 | 226 | |||
| C4 | 215 | 235 | |||
| C5 | 217 | 240 |
Group A grew 0.96%, Group B grew 5.18%, and Group C grew 9.61% relative to initial heights.
Discussion
The discussion is typically the longest section, where you analyse and interpret your findings.
1. Analysis and evaluation of primary data
Begin by restating your hypothesis and indicating whether your results support or refute it. Then analyse why you obtained these results.
Analysis involves examining your data in relation to your research question. What patterns emerge? What do the numbers tell you? How do these findings address your original question?
Consider the type and quality of data you collected. Primary quantitative data from controlled experiments generally provides strong evidence for cause-and-effect relationships.
Example Analysis:
"It was hypothesised that increased sunlight exposure would result in increased plant growth. The results support this hypothesis. Plants in Group C (full sunlight) grew significantly more relative to their original height (9.61%) compared to Group B (moderate sunlight, 5.18%) and Group A (no sunlight, 0.96%). This clear trend demonstrates that sunlight exposure positively affects Ficus lyrata bambino growth."
2. Linking results to biological concepts
Explain your findings using the biological theory you introduced earlier. This demonstrates your understanding of how your results relate to broader scientific concepts.
Example Linking to Concepts:
"Given the importance of light in photosynthesis, increased growth in plants exposed to more sunlight is expected. The extra energy these plants generated through photosynthesis enabled their cells to grow and replicate at a greater rate compared to plants kept in darkness, resulting in greater height increase during the two-week period."
3. Identifying outliers
Note any unusual results and explain possible causes. Decide whether to include or exclude outliers from your analysis, and justify this decision clearly.
Example Outlier Treatment:
"Plant C1 did not grow as much as other plants in Group C. Unlike all other plants, C1 was knocked over during the experiment, causing it to fall from its pot. This introduced an uncontrolled variable, making it difficult to compare C1's results with other plants. Consequently, C1 data has been excluded from analysis as it is no longer useful for answering the research question."
4. Evaluation - identifying limitations and suggesting improvements
Critically examine your investigation's strengths and weaknesses. Consider potential sources of error and their impact on results.
Types of errors:
Personal errors - Mistakes made by the experimenter, such as miscounting, incorrect rounding, or mislabelling samples.
Systematic errors - Affect accuracy. Results consistently differ from the true value by the same amount, usually due to faulty equipment or poor calibration.
Random errors - Affect precision. Caused by unpredictable variations in measurement, leading to inconsistent results across replicates.
Types of bias:
Confirmation bias - Tendency to include only information supporting your hypothesis while ignoring contradictory evidence.
Selection bias - Non-random participant selection producing a sample that doesn't represent the wider population.
Publication bias - When only studies with positive findings get published, whilst those with negative results remain unreported.
After identifying limitations, suggest specific improvements for future investigations. How could these issues be addressed? What would you do differently?
Finally, weigh limitations against strengths. Can your results still be trusted despite these issues?
Example Evaluation:
"Several factors may have influenced results. The tape measure, whilst having 1 mm markings, may not have been the most precise tool available. This could have introduced random or personal error. Future research should use more accurate measuring devices, such as laser measures or digital callipers.
Additionally, measuring plant height may not fully capture photosynthesis effects. Plants might have grown extensive root systems, increased in width, or developed thicker stems without substantial height increase. Weight-based measurements might provide more comprehensive understanding of sunlight's effect on growth.
Furthermore, only one plant species was studied. Other plants may respond differently to varying light levels.
Despite these limitations, the clear trend in results suggests that exposing Ficus lyrata bambino to more sunlight does increase its growth."
Conclusion
Many students worry about conclusions, but they follow a straightforward structure:
1. Restate the research question
Remind readers what you investigated.
2. State whether your hypothesis was supported or refuted
Clearly indicate what your data showed.
3. Suggest future research directions
Based on your findings and limitations, what should be investigated next? How could future studies improve upon your work?
4. Explain broader implications
How do your findings matter to the real world? Why should people care about your results?
Leave your reader convinced that your investigation was worthwhile and your findings have practical significance.
Example Conclusion:
"This investigation examined the effect of variable sunlight exposure on Ficus lyrata bambino growth. It was hypothesised that plants exposed to higher light levels would grow more than those with less exposure. The results supported this hypothesis, showing that plants in full sunlight grew faster than those in moderate or no sunlight.
Future research should refine measuring techniques and explore how other environmental factors influence plant growth. Investigating other office-suitable plant species would also be valuable, as would examining the relationship between healthy office plants and worker morale.
Nevertheless, these findings indicate that sunlight availability should be considered when placing office plants. Since sunlight appears to be a key determinant of plant growth, and healthy plants contribute greatly to workplace atmosphere and employee mood, ensuring plants receive adequate light exposure is important for maximising these benefits."
References and acknowledgements
Referencing
Cite all sources used in your investigation. Only include sources you actually referenced in your work, not everything you read.
Check with your teacher which referencing style to use. APA and Harvard are common for VCE Biology.
Referencing includes two components:
In-text citations - Brief references in your report's body, used immediately after mentioning information from a source. Mainly appear in introductions and discussions.
Reference list - Complete list of all cited sources at your report's end.
APA Style Example:
In-text citation: "Having indoor plants in an office space increases employees' mood and perceived comfort levels whilst at work (Larsen et al., 1998)."
Reference list entry: Larsen, L., Adams, J., Deal, B., Kweon, B. S., Tyler, E. (1998). Plants in the workplace: the effects of plant density on productivity, attitudes, and perceptions. Environment and Behaviour, 30(3), 261-281.
Harvard Style Example:
In-text citation: "Having indoor plants in an office space increases employees' mood and perceived comfort levels whilst at work (Larsen et al., 1998, p.261)."
Reference list entry: Larsen, L, Adams, J, Deal, B, Kweon, B. S & Tyler, E 1998, 'Plants in the workplace: the effects of plant density on productivity, attitudes, and perceptions', Environment and Behaviour, vol. 30, no. 3, pp. 261-281.
Acknowledgements (optional)
You may include a brief acknowledgements section thanking people who helped with your investigation. Keep it concise and professional.
Key concepts summary
Key Points to Remember:
Research question criteria:
- Testable through practical experimentation
- Achievable with available resources
- Specific and well-defined
Variables in controlled experiments:
- Independent variable (IV) - what you change
- Dependent variable (DV) - what you measure
- Controlled variables - what you keep constant
Quality measures:
- Accuracy - closeness to true value
- Precision - consistency between measurements
- Reproducibility - others can replicate your method
- Repeatability - you can replicate your own method
- Validity - measures what it claims to measure
Types of data:
- Quantitative - numerical measurements
- Qualitative - descriptive observations
- Primary - you collect it yourself
- Secondary - collected by others
Error types:
- Personal - experimenter mistakes
- Systematic - consistent equipment/calibration issues affecting accuracy
- Random - unpredictable variations affecting precision
Bias types:
- Confirmation - only including supporting evidence
- Selection - non-representative sample
- Publication - only positive results get published
Remember!
Critical Requirements for Your Investigation:
- Your research question must relate to Unit 1 content about cell function and/or regulation of biological systems
- Always clearly define your independent, dependent, and controlled variables with appropriate units
- A hypothesis predicts the relationship between variables based on biological theory
- Maintain a detailed logbook throughout your investigation for authentication and documentation
- Transform your raw data into meaningful formats (graphs, tables, percentages) that highlight trends and patterns relevant to your research question
- The discussion should link your findings to biological concepts, identify limitations, suggest improvements, and evaluate the reliability of your conclusions