Data Collection and Quality (VCE SSCE Chemistry): Revision Notes
Data Collection and Quality
Introduction
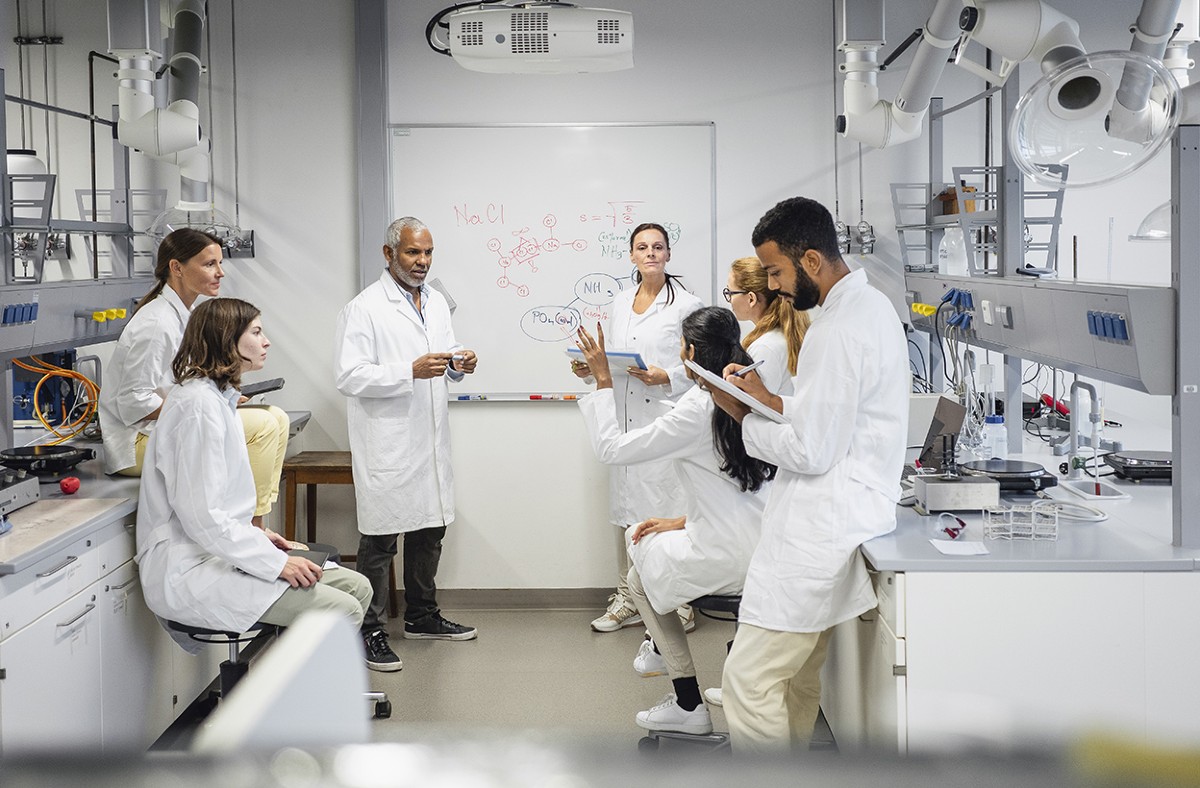
Data collection is a fundamental part of conducting controlled experiments in chemistry. This involves recording both qualitative observations (such as color changes or gas production) and quantitative measurements (such as mass, temperature, or volume). The quality of your data directly affects the validity of your conclusions, so understanding how to collect, record, and evaluate data is essential for successful scientific investigation.
The quality of your data directly determines the reliability of your conclusions. Poor quality data leads to unreliable results, regardless of how well you analyze it. That's why mastering data collection techniques is one of the most important skills in chemistry.
Keeping a logbook
A logbook is a bound book where you record every detail of your experimental research. Keeping a proper logbook is essential for staying organized and preventing loss of important information.
Why use a logbook?
Using a bound logbook rather than loose sheets of paper helps you:
- Stay organized throughout your investigation
- Keep all your research details in one place
- Prevent loss of important observations and results
- Track your experimental progress over time
Your logbook should be kept in the laboratory so it's always accessible when conducting experiments. Never use loose sheets of paper that can be easily lost or damaged.
What to include in your logbook
Essential Logbook Contents:
Make sure your logbook contains:
- Your initial ideas when planning the research
- Data tables prepared and ready for recording results
- Notes about what data you will collect and how you plan to analyze it
- Complete records of all materials and methods
- Details of the experimental procedure
- All raw data (the measurements and observations you collect directly)
- Sketches, photographs, and results
- Records of any incidents, errors, or unexpected observations
- Any modifications you make to your method
- Dates for all entries
A well-maintained logbook provides a complete record of your investigation and shows your thought process throughout the research.
Determining and modifying your method
Writing a clear method
Your experimental method must clearly explain:
- How you will change the independent variable (the variable you deliberately alter)
- How you will measure the dependent variable (the variable that responds to changes)
- Which controlled variables will remain constant throughout the experiment
- When you will repeat measurements
- When you will change to the next variation of the independent variable
The method should be detailed enough that another person could replicate your experiment by following your instructions. Sometimes a diagram of your equipment setup can be helpful.
Making modifications
You may need to modify your method as you conduct the investigation. When this happens:
- Record everything in your logbook
- Note any difficulties you encountered
- Explain how you overcame these difficulties
Don't worry if you don't get the expected results. Every test contributes to understanding the investigation, even if results seem disappointing at first. Critically evaluate your data, identify the limitations, and use this information to propose further investigations.
Data collection fundamentals
Raw data vs processed data
Raw data is the data you measure or observe directly during your investigation. This is also called primary data. Examples include:
- Direct measurements from instruments (mass, volume, temperature)
- Qualitative observations (color changes, precipitate formation)
- All trial results
Processed data is raw data that has been organized, altered, or analyzed to produce meaningful information. Examples include:
- Calculated averages from multiple trials
- Values determined using formulas applied to raw data
- Graphs showing trends in your data
Both raw and processed data should be recorded in tables in your logbook.
Qualitative and quantitative data
Qualitative data consists of observations that relate to a type or category. Examples include:
- Color of a solution (e.g., "changed from colorless to purple")
- State of matter (solid, liquid, gas, aqueous)
- Physical appearance (cloudy, clear, crystalline)
- Evidence of a chemical reaction (precipitate formation, gas production, temperature change without measurement)
Recording Qualitative Observations:
When recording qualitative data, focus on what you actually observe rather than making assumptions. For example, if you see bubbles during electrolysis, record "gas produced at the cathode" rather than assuming it's hydrogen (unless you've confirmed this with a test).
Quantitative data consists of measured numeric values accompanied by appropriate units. Examples include:
- Mass measured in grams (g)
- Time measured in seconds (s)
- Temperature measured in degrees Celsius (°C) or kelvin (K)
- Volume measured in milliliters (mL) or liters (L)
- pH measured on the pH scale
Quantitative data can be:
- Discrete data: Values that can only be certain numbers (e.g., number of hydrogen atoms in a molecule)
- Continuous data: Values that can be any number within a range (e.g., time, temperature, mass, pH, concentration)
Presenting raw data in tables
Tables help organize your data into clear rows and columns. A well-constructed data table has specific features that make it easy to read and understand.
Essential Features of a Good Data Table:
- Descriptive title: Numbered and clearly describes what the table contains
- Column headings: Include the name of the variable and its unit in brackets
- Independent variable: Placed in the left-hand column
- Dependent variable(s): Placed in the right-hand column(s)
- Consistent precision: All data in the same column recorded to the same number of decimal places
- Multiple trials: Each row shows results from a different trial or replicate
Understanding units
Every column in a quantitative data table must include appropriate units. In chemistry, we typically use SI units (International System of Units).
Common SI units include:
| Quantity | SI unit | Symbol |
|---|---|---|
| Mass | kilogram (but chemists usually use grams) | kg (g) |
| Time | second | s |
| Temperature | kelvin | K |
| Electric current | ampere | A |
| Amount of substance | mole | mol |
| Volume | liter | L |
| Charge | coulomb | C |
| Energy | joule | J |
Data quality
The quality of your data analysis depends on the quality of the data you collect. Understanding data quality concepts helps you conduct better investigations and evaluate data from other sources.
Accuracy and precision
Precision describes how close repeated measurements are to each other. Measurements are precise when:
- Values from multiple trials are in close agreement
- Values are very close to the mean (average) of all measurements
- Random errors are minimized
Accuracy describes how close a measurement is to the true value (the value that would be obtained under perfect conditions). Measurements are accurate when:
- The average of multiple measurements is very close to the true value
- Systematic errors are minimized
Critical Distinction:
Precision and accuracy are separate concepts. Precise measurements aren't necessarily accurate, and accurate measurements aren't necessarily precise.
Understanding Accuracy vs. Precision: The Target Analogy
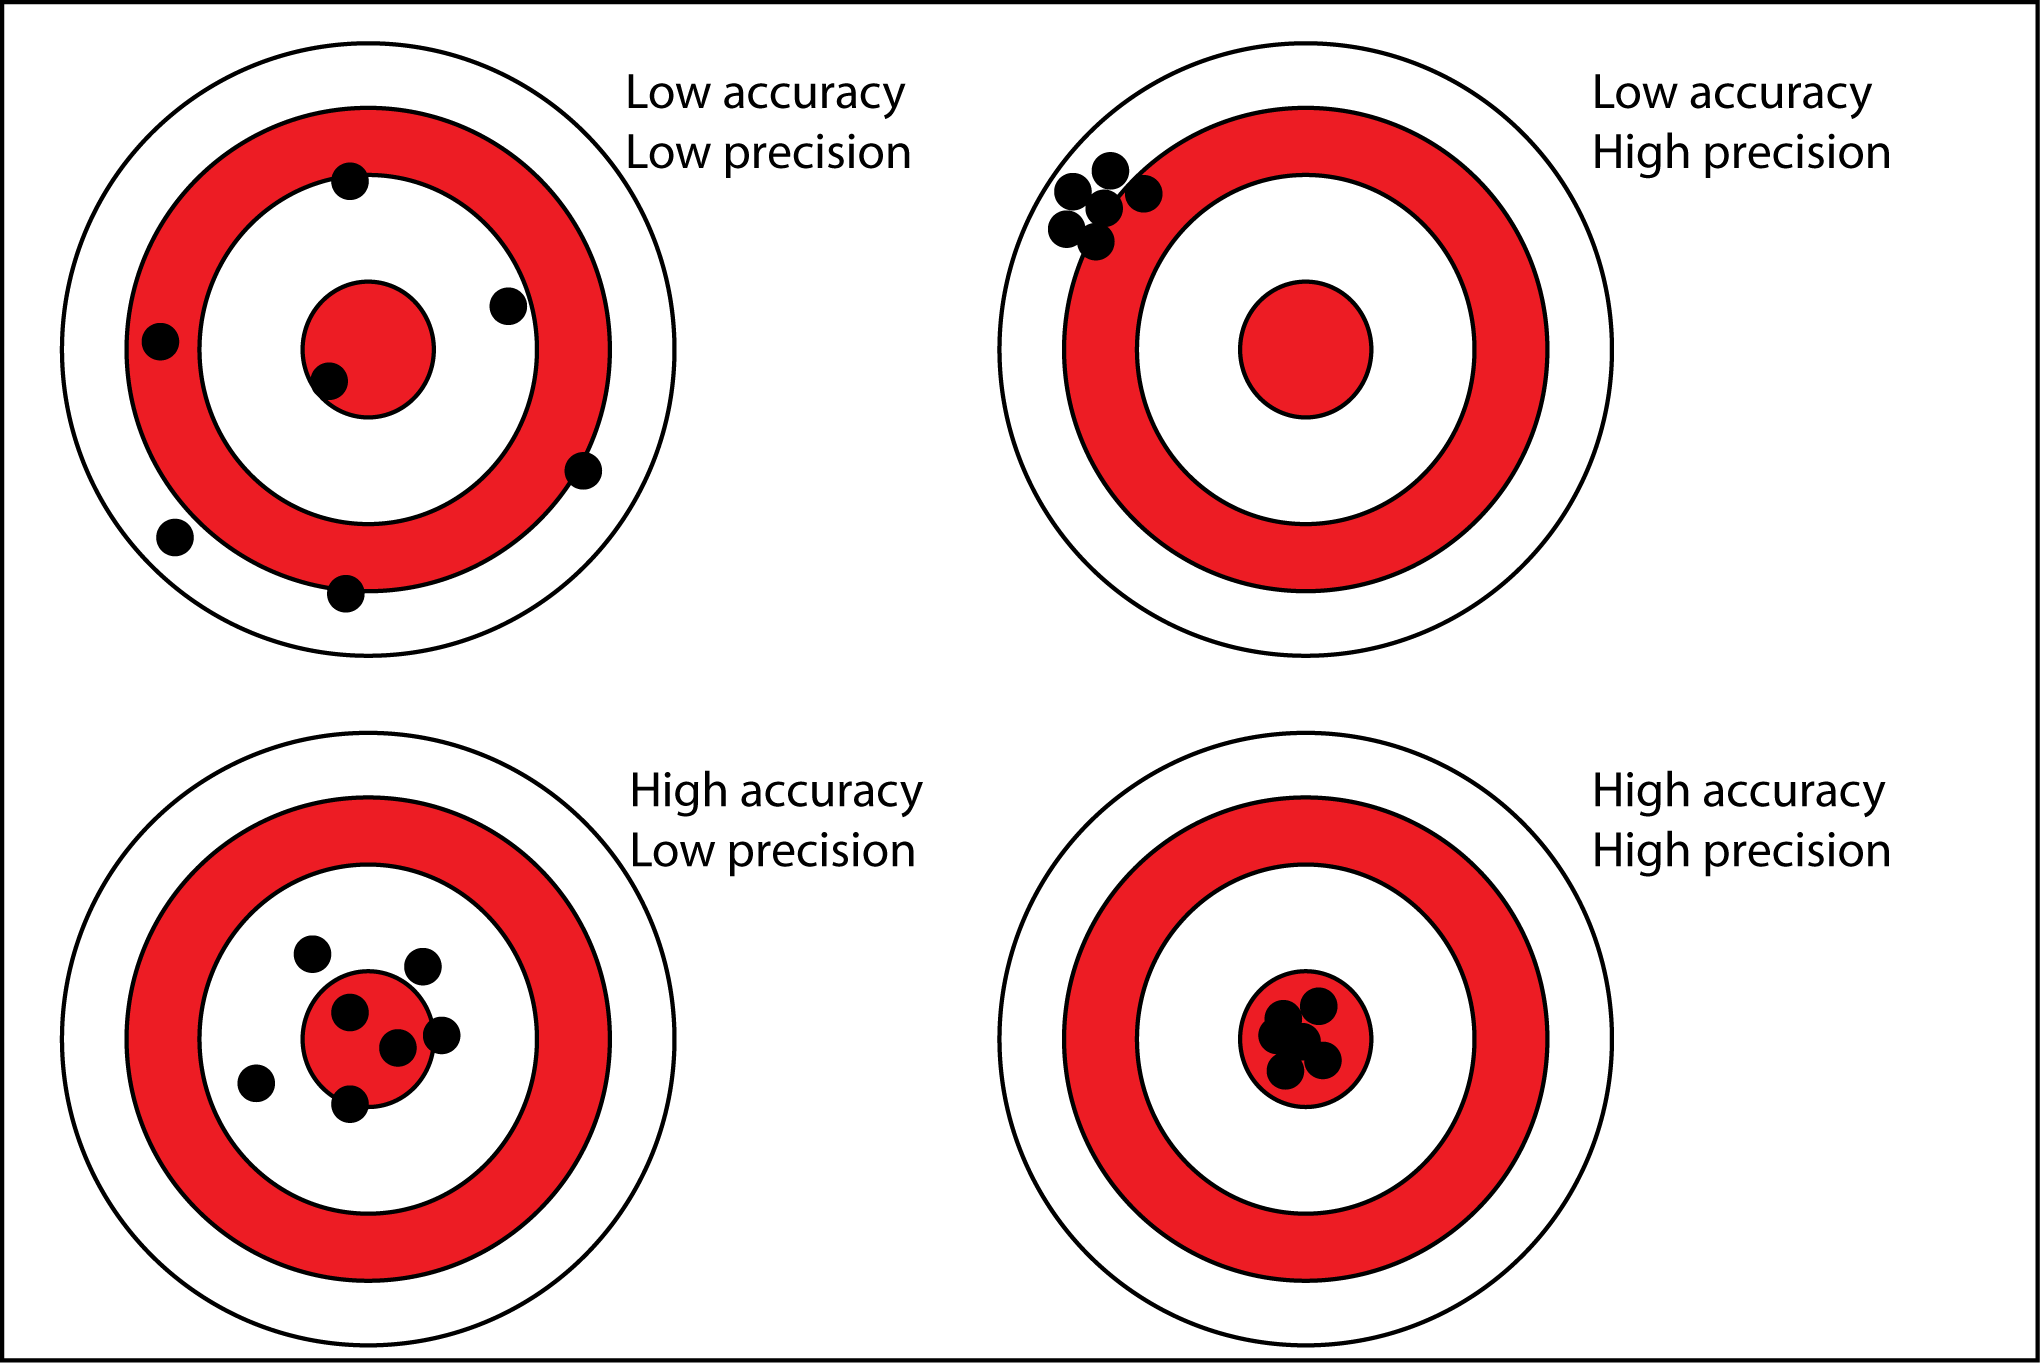
Think of accuracy and precision like shooting at a target:
- High precision, low accuracy: All arrows hit the same spot, but not the center (bullseye)
- Low precision, high accuracy: Arrows scattered around but centered on the bullseye
- High precision, high accuracy: All arrows hit the center
- Low precision, low accuracy: Arrows scattered all over the target
When the true value is known, the difference between the true value and a measured value is called the measurement error. Often, the true value is unknown, so the measurement error cannot be calculated.
Significant figures
Significant figures indicate the precision of the measuring instrument used. They show the range within which a value exists.
Understanding Significant Figures:
- g has significant figures, indicating the value is between g and g
- g has significant figures, indicating the value is between g and g
When recording measurements, report values as accurately as possible within the equipment's limitations. If a balance displays g, record exactly g (not g or g).
Rules for counting significant figures:
- All non-zero digits are significant
- Zeros may or may not be significant:
- Zeros after the last non-zero digit are significant (e.g., has significant figures)
- Zeros before the first non-zero digit are not significant (e.g., has significant figures)
- Whole numbers without decimal points have as many significant figures as digits (e.g., has significant figures)
- Significant figures only apply to measurements and calculations, not to:
- Integers or fractions (e.g., stoichiometric ratios)
- Defined quantities (e.g., meter centimeters)
- Conversion factors (e.g., multiplying by for percentage)
Types of errors
Most investigations involve errors that affect data quality. Understanding different error types helps you minimize their impact.
Three Types of Errors:
Systematic errors produce a constant bias that cannot be eliminated by repeating measurements. The error is always in the same direction, making all measurements consistently too high or too low.
Random errors follow no regular pattern. Measurements are sometimes too large and sometimes too small.
Mistakes (also called personal errors) are avoidable errors that should not occur with careful work.
Examples of systematic errors:
- A pH meter that hasn't been calibrated, consistently recording values higher than true pH
- An unsuitable indicator in a titration
- Heat loss to surroundings due to inadequate insulation when measuring temperature
- Parallax error when reading a burette or measuring cylinder
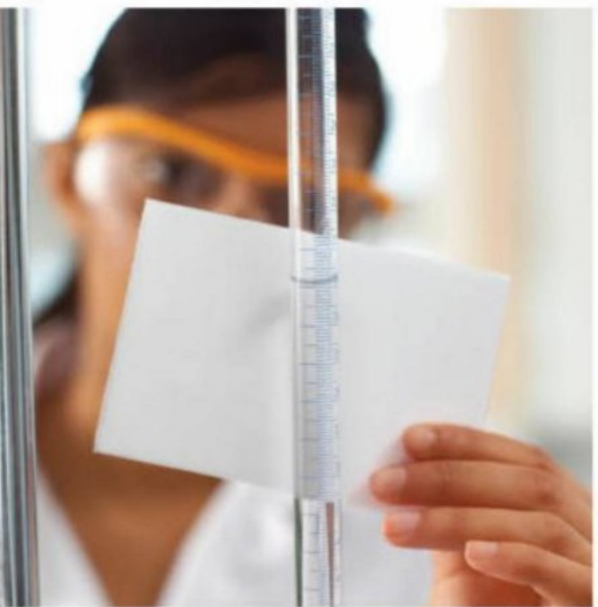
Parallax error occurs when you don't read the meniscus (curved liquid surface) at eye level. Always position your eyes level with the meniscus to avoid this systematic error.
Examples of random errors:
- Estimating the second decimal place when reading a burette
- Temperature variation in a solution that hasn't been mixed thoroughly
- Difficulty judging the exact color change of an indicator
You can reduce random errors by:
- Taking multiple measurements and calculating the mean (average)
- Repeating techniques until you become more skilled
Examples of mistakes:
- Misreading numbers on a scale
- Inadequate labeling of samples
- Spilling part of a sample
If a mistake occurs, you must repeat the measurement or reject the result. Careful experimental technique prevents most mistakes.
Repeatability and reproducibility
Repeatability refers to the consistency of results when you repeat the experiment multiple times under the same conditions.
To ensure repeatability:
- Perform sufficient replication (generally at least trials)
- Use the same equipment and procedure each time
- Record all trial results, not just the "best" ones
Conducting more than three trials can improve precision, partly because you become more familiar with the method.
Reproducibility is the closeness of agreement between measurements under changed conditions. Data is reproducible if:
- Different operators obtain similar results
- Different laboratories using the same procedure obtain similar results
- The experiment works under slightly varied conditions
Reproducibility helps identify systematic errors that affect accuracy.
Resolution
Resolution is the smallest change in the measured quantity that produces a noticeable change in the displayed value. Resolution determines how many decimal places you should record.
Resolution differs for analogue and digital instruments:
Analogue instruments (e.g., burettes):
- If a burette has resolution of mL, possible readings are mL or mL, but not mL
- Read to the nearest line marking
Digital instruments (e.g., electronic balances):
- Resolution is the last decimal place displayed
- A balance showing g has resolution of g
Remember that instrument resolution doesn't always determine practical precision. For example, a phone app might show time to s, but human reaction time is about s, limiting practical accuracy.
Validity
Validity refers to whether your experiment actually tests your hypothesis and meets your aims.
To ensure validity:
- Change only one variable at a time (the independent variable)
- Keep all other variables constant (controlled variables)
- Design the method to specifically test your hypothesis
- Ensure measurements actually relate to your research question
Valid experiments allow you to draw meaningful conclusions about the effect of the independent variable on the dependent variable.
Techniques for improving data quality
Calibration
Calibration is the process of adjusting an instrument using a known reference or standard.
Examples of Calibration:
- Checking that a pH probe correctly reads pH when placed in a standard buffer solution
- Creating a calibration curve in colorimetry showing the relationship between known concentrations and absorbance values
Using calibrated equipment increases confidence that your measured values are accurate.
Equipment selection
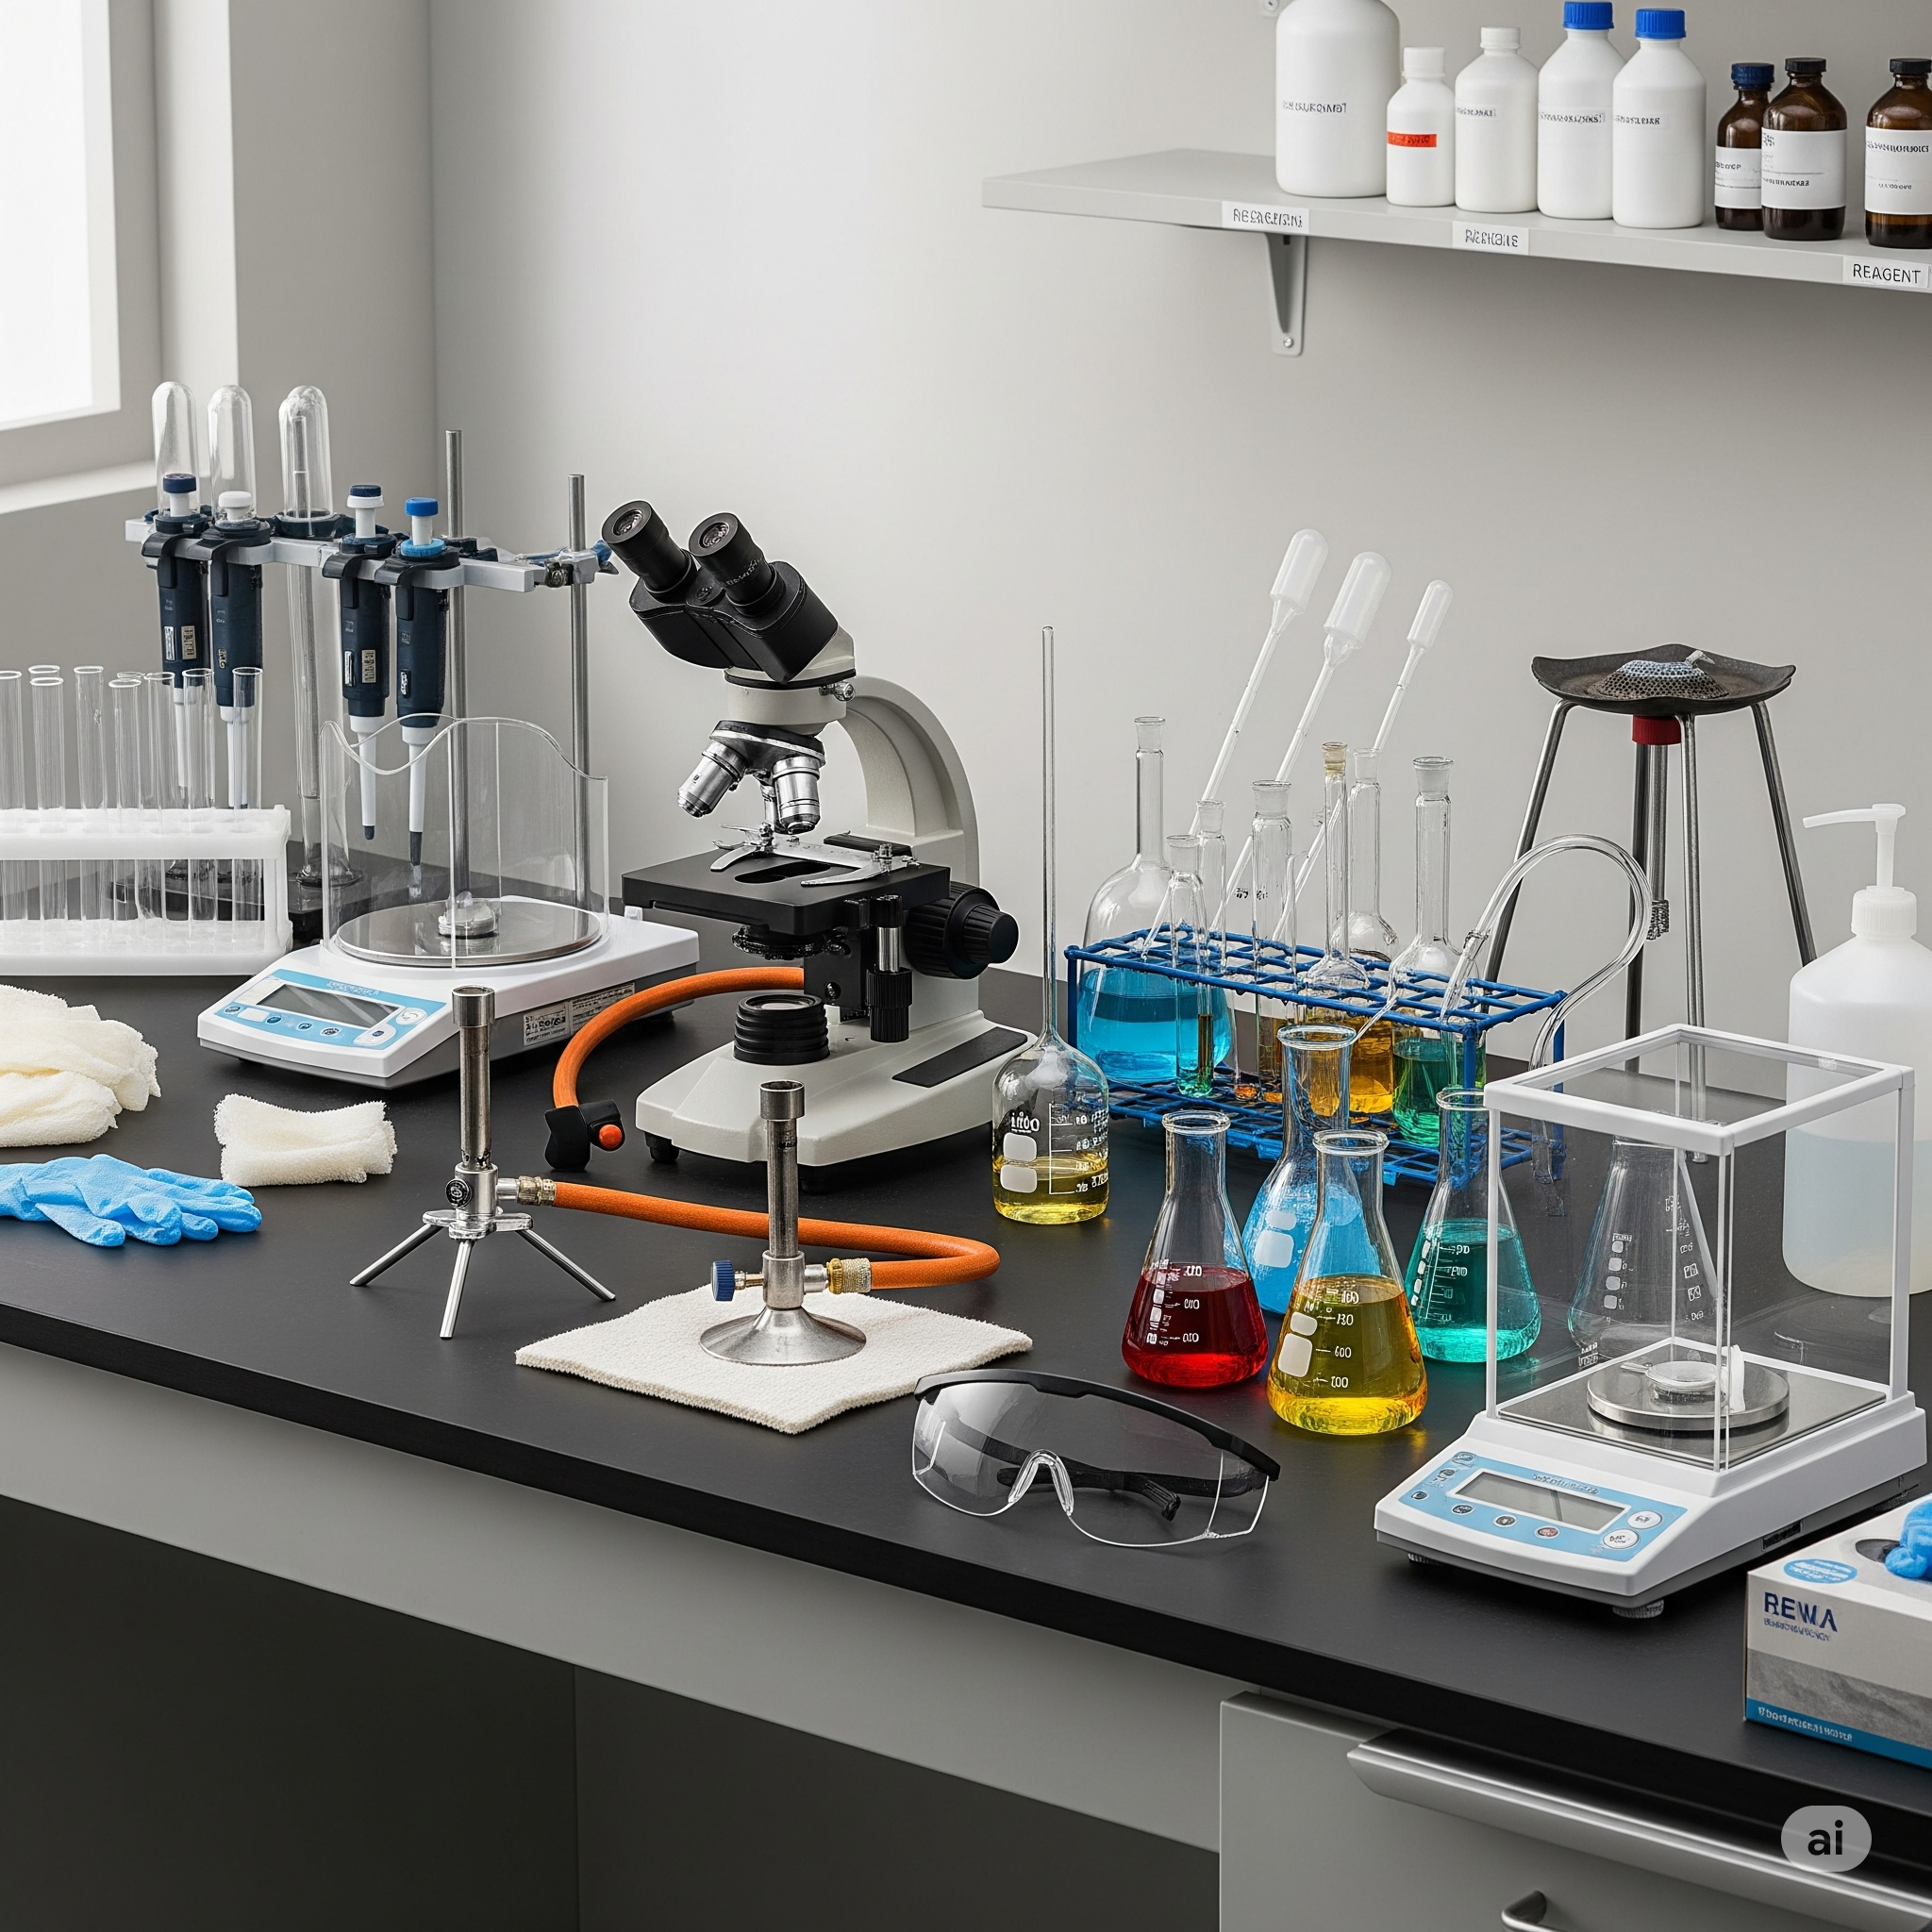
Choose equipment with appropriate precision for your investigation:
- Higher precision: Pipettes, burettes, and volumetric flasks
- Lower precision: Measuring cylinders
Even high-precision equipment requires correct technique to minimize errors. Always use equipment properly and read measurements carefully.
Sample size
In general, larger samples produce more precise measurements.
For example, if you measure g instead of g using the same balance, any error in the balance represents a smaller percentage of the total mass. The percentage error is smaller for the larger mass.
However, don't be wasteful. Green chemistry principles encourage minimizing waste while maintaining sufficient precision for valid results.
Techniques to support your practical investigation
Several specialized techniques can help you collect high-quality data for different types of investigations.
Overview of techniques
| Technique | Purpose | Dependent variable | Example application |
|---|---|---|---|
| Titration | Calculate unknown concentration of a solution | Volume of solution (titre) | Determining concentration of reagents in redox reactions |
| Data logging | Collect data over a defined period of time | Change in pH, temperature, conductivity, color, CO₂ concentration, pressure, time | Monitoring temperature or pH changes during a reaction |
| Calorimetry | Determine energy released or absorbed by a chemical reaction | Temperature change of known volume of water in a calorimeter | Determining enthalpy of combustion of fuels or enthalpy of reaction |
| Electrochemistry | Measure voltage or current of a galvanic or fuel cell | Voltage or current | Comparing voltage of a galvanic cell when electrolyte concentration varies |
Data logging
Modern data logging involves connecting sensors to computers, tablets, or phones to collect data automatically. This technology has significantly improved data collection in school laboratories.
Benefits of Data Logging:
- Produces real-time graphs during the experiment
- Allows data collection over extended periods
- Reduces human error in reading instruments
- Enables advanced calculations directly from software
- Creates downloadable or printable results
Common data logging probes include pH probes, temperature probes, carbon dioxide or oxygen concentration probes, conductivity probes, colorimeters, and automatic mass balance equipment.
Data logging plays an important role in improving data quality across many types of chemistry investigations.
Remember!
Key Points to Remember:
-
Keep a detailed logbook in the laboratory containing all planning, methods, observations, raw data, and modifications.
-
Raw data is what you directly measure or observe; processed data is calculated from raw data. Record both types clearly in tables with proper units.
-
Accuracy means closeness to the true value (minimize systematic errors); precision means closeness of repeated measurements to each other (minimize random errors). These are different concepts.
-
Minimize errors by calibrating equipment, choosing appropriate instruments, using proper technique, and repeating measurements multiple times (at least trials).
-
Ensure validity by changing only one variable at a time, keeping all other variables constant, and designing methods that actually test your hypothesis.