Leslie Matrices (VCE SSCE General Mathematics): Revision Notes
Leslie Matrices
Leslie matrices are mathematical tools used to model how populations change over time. They are particularly useful for tracking different age groups within a population and predicting future population sizes.
Background and purpose
Leslie matrices were created by Patrick Holt Leslie (1900-1972) whilst working at the Bureau of Animal Population at the University of Oxford. Biologists and ecologists use these matrices to model changes in animal populations over time.
These matrices help us understand:
- How population sizes change across different age groups
- The overall growth or decline of a population
- Long-term population trends
Critical assumption: Only female members of the species are counted in Leslie matrix models, because females give birth to new members of the population.
Understanding age groups
To use a Leslie matrix, we first divide the population into age groups. Each age group covers the same time period, and together they span the entire lifespan of the species.
Example with humans: If we use a time period of 10 years, we might have eleven age groups:
| Age group | 1 | 2 | 3 | 4 | 10 | 11 | |
|---|---|---|---|---|---|---|---|
| Age range (years) | 0-10 | 10-20 | 20-30 | 30-40 | 90-100 | 100-110 |
Key components of Leslie matrices
Birth rates
The birth rate, , represents the average number of female offspring born to a mother in age group during one time period.
Example: Women in age group 4 (aged 20-30 years) might have an average birth rate of . This means that, on average, each woman in this age group gives birth to 1.7 female children over the 10-year period.
Survival rates
The survival rate, , represents the proportion of females in age group who survive to move into age group .
Key facts about survival rates:
- Survival rates are always between 0 and 1:
- A survival rate of 1 means 100% survival
- A survival rate of 0.95 means 95% survival
- The survival rate of the final age group is always taken as 0
Example: If the survival rate for age group 2 is , this means 95% of females aged 10-20 years will survive to reach age group 3 (20-30 years).
Structure of a Leslie matrix
Simple example with three age groups
Let's examine a population with a lifespan of 9 years, divided into three age groups with a time period of 3 years:
| Age group | 1 | 2 | 3 |
|---|---|---|---|
| Age range (years) | 0-3 | 3-6 | 6-9 |
For three age groups, the Leslie matrix is a matrix:
Specific example: If , , , , and , then:
Understanding the matrix structure:
- The first row contains birth rates
- The entries just below the main diagonal contain survival rates
- All other entries are zero
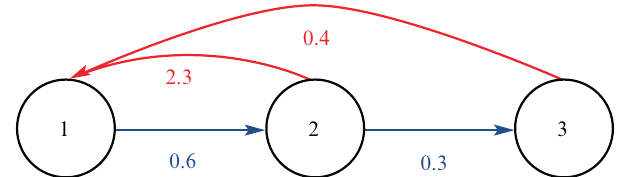
This diagram shows how the population transitions between age groups, with curved arrows showing births and straight arrows showing survival.
Population state matrix
The population state matrix is a column vector that records the number of females in each age group at a specific time.
The initial population state matrix is denoted .
Example: If initially there are 400 females in each age group:
where each entry represents:
- First entry: number in age group 1
- Second entry: number in age group 2
- Third entry: number in age group 3
Calculating future populations
Using the recursive formula
To find the population after one time period, we multiply the Leslie matrix by the initial state matrix:
Interpretation: After one time period (3 years):
- Age group 1: 1080 females
- Age group 2: 240 females
- Age group 3: 120 females
- Total population: (increased from 1200)
For the second time period:
Total population after two time periods:
Pattern in calculations
Notice the pattern:
In general:
The explicit formula
To find the population state matrix after time periods, we use:
Example: To find :
General form of Leslie matrices
An Leslie matrix (for age groups) has the form:
where:
- is the number of age groups
- is the survival rate (proportion moving from age group to age group )
- is the birth rate (average number of female offspring from age group )
Formulas for population calculations
Recursive formula: Starting with initial state :
Explicit formula: For the state after time periods:
Worked example: Determining state matrices and life cycle diagrams
Given Leslie matrix and initial state:
a) Finding birth and survival rates:
i) The birth rate for age group 2 is found in row 1, column 2:
ii) The survival rate for age group 3 is found in row 4, column 3:
b) Life cycle diagram:
From the matrix:
- Survival rates: , ,
- Birth rates: , ,
c) Calculating population state matrices:
Using a calculator:
d) Given , find :
Worked example: Entering information into matrices
Given data for a population of female goats:
| Age group (years) | 0-1 | 1-2 | 2-3 | 3-4 | 4-5 |
|---|---|---|---|---|---|
| Initial population | 10 | 25 | 40 | 20 | 15 |
| Birth rates | 0 | 0.2 | 0.9 | 0 | 0 |
| Survival rates | 0.6 | 0.7 | 0.5 | 0.2 | 0 |
a) Initial population state matrix:
b) Leslie matrix:
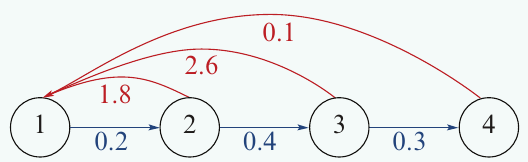
c) Life cycle transition diagram:
The diagram shows:
- Survival rates: , , ,
- Birth rates: , , ,
d) Population after 3 years:
Rounding to the nearest whole number: 2 goats in the 3-4 year age group after 3 years.
Long-term (limiting) behaviour
After many time periods, populations modelled by Leslie matrices can exhibit different behaviours:
- Increase without bound
- Decrease towards zero
- Stabilise at constant proportions
- Oscillate in cycles
Limiting behaviour with constant growth rate
Sometimes, after enough time periods, the proportion of the population in each age group stabilises. When this happens, we can find a constant growth rate such that:
This means each age group grows by the same factor each time period.
Example: Consider:
Calculating successive states shows that after time period 14:
This means the population is growing at a constant rate of 1.2 (or 20% per time period).
The age group proportions also stabilise at:
Different types of long-term behaviour
Consider with
Case 1: If
The population cycles through three states:
The population oscillates with period 3.
Case 2: If
The population decreases towards zero.
Case 3: If
The population increases without bound.
Calculator techniques
To calculate :
- Store the Leslie matrix as matrix
- Store the initial state as matrix
- Calculate using your calculator's matrix functions
Exam tip: Make sure you know how to raise a matrix to a power on your calculator, as this significantly speeds up calculations.
Remember!
Key Points to Remember:
- Leslie matrices model female populations only - females give birth to new population members
- Structure: Birth rates in the first row, survival rates on the subdiagonal, zeros elsewhere
- Two formulas: Recursive () and explicit ()
- Survival rates must be between 0 and 1 ()
- Long-term behaviour can be increasing, decreasing, stable, or oscillating
- Use your calculator for matrix powers - it saves time and reduces errors in exams