Setting Up and Interpreting Transition Matrices (VCE SSCE General Mathematics): Revision Notes
Setting Up and Interpreting Transition Matrices
Introduction to transition matrices
A transition matrix is a special type of matrix that describes how things move or change between different states over time. These matrices are powerful tools for modelling real-world situations where items, people, or conditions shift from one category to another.
Transition matrices are widely used in many fields including economics, biology, computer science, and operations research. They help us understand and predict patterns of change in complex systems.
Understanding states and transitions
A state represents a particular condition or location at a given time. For example, in a car rental business with two branches, a car can be in one of two states:
- State 1: The car is based in Bendigo
- State 2: The car is based in Colac
A transition occurs when something moves from one state to another. Transition matrices track the probability or proportion of these movements.
A real-world example: The car rental problem
Consider a car rental company with branches in Bendigo and Colac. Most cars are rented and returned in the same town, but some are returned to the other location. The diagram below shows what happens on a weekly basis:
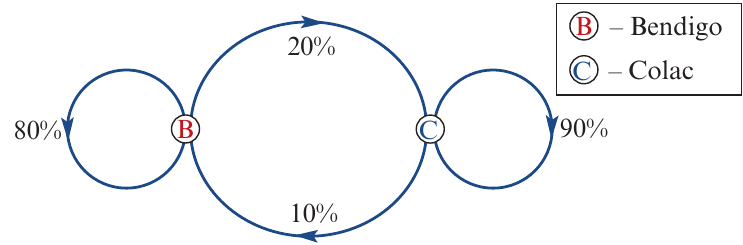
This diagram tells us that from week to week:
- (or ) of cars rented in Bendigo are returned to Bendigo
- (or ) of cars rented in Bendigo are returned to Colac
- (or ) of cars rented in Colac are returned to Bendigo
- (or ) of cars rented in Colac are returned to Colac
We can summarise this information in matrix form:
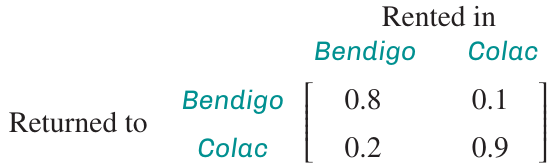
Setting up a transition matrix from a diagram
Understanding the structure
When constructing a transition matrix, remember these key principles:
Essential Rules for Transition Matrices:
Columns represent the starting state - where items begin (e.g., where cars are rented)
Rows represent the ending state - where items finish (e.g., where cars are returned)
Each column must sum to 1 - this represents of the items, as everything must end up somewhere
Two-state systems
For a system with two possible states, you need a matrix.
Step-by-step process:
- Draw a blank matrix and label both rows and columns with your state names
- Fill in the first column by reading the probabilities from the diagram
- Fill in the second column the same way
- Check your work: each column should sum to (or )
Three-state systems
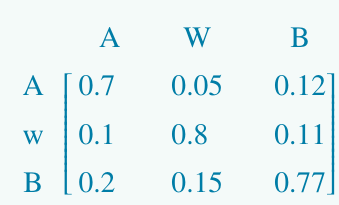
For systems with three states, you need a matrix. The process is the same, but you have more entries to fill in.
Consider this example with three locations: Albury, Wodonga, and Benalla:
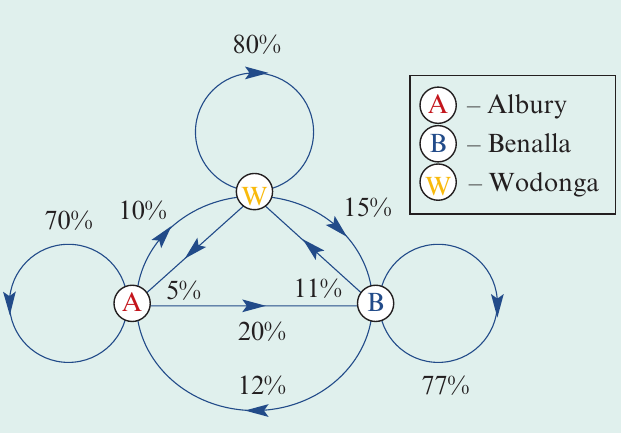
Worked Example: Creating a 3×3 Transition Matrix
To create the transition matrix:
Step 1: Set up a blank matrix with appropriate labels
Label the columns: A (Albury), W (Wodonga), B (Benalla) - these represent where cars are rented in
Label the rows: A, W, B - these represent where cars are returned to
Step 2: Fill in column A
Read from the diagram all transitions starting from Albury:
- stay in Albury → enter in row A
- go to Wodonga → enter in row W
- go to Benalla → enter in row B
Step 3: Fill in columns W and B using the same method
Step 4: Verify each column sums to
The completed matrix looks like this:
Setting up a transition matrix from written information
Sometimes you'll need to construct a transition matrix from a written description rather than a diagram. The process is similar, but you must carefully identify the states and transitions from the text.
Worked Example: Factory Machines
A factory has machines that can be in one of two states: operating (O) or broken (B). On any given day:
- of machines that are operational stay operating
- of machines that are operating break down
- of machines that are broken are repaired and start operating
- of machines that are broken stay broken
Solution:
Step 1: Identify the states
There are two states: Operating (O) and Broken (B)
We need a matrix
Step 2: Set up the blank matrix
Use columns to represent the state at the start of the day
Use rows to represent the state at the end of the day
Step 3: Fill in column O (machines that start the day operating)
From the given information:
- 85% stay operating → in row O
- break down → in row B
Step 4: Fill in column B (machines that start the day broken)
From the given information:
- get repaired → in row O
- stay broken → in row B
Step 5: Verify and present the final matrix
Check that columns sum to : ✓ and ✓
where the columns represent Start (O, B) and rows represent End (O, B).
Interpreting transition matrices
Once you have a transition matrix, you can use it to make predictions about future states.
Reading probabilities from the matrix
Finding Transition Probabilities:
To find the probability of moving from one state to another:
- Locate the column representing the starting state
- Look down that column to the row representing the ending state
- The number at that position is the probability (as a proportion)
Making predictions
Transition matrices allow us to predict how many items will be in each state after a transition.
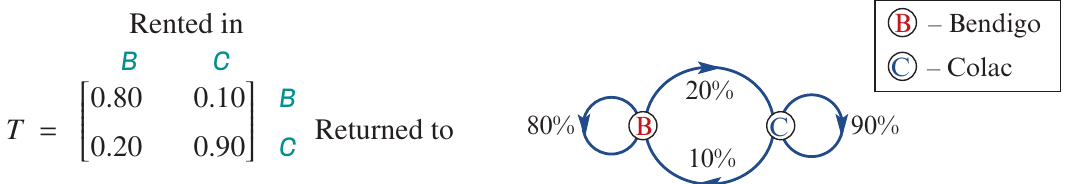
Using the Bendigo-Colac example above:
Worked Example: Predicting Car Returns
If 50 cars are rented in Bendigo this week:
- Expected returns to Bendigo: = 40 cars
- Expected returns to Colac: = 10 cars
If 40 cars are rented in Colac this week:
- Expected returns to Bendigo: = 4 cars
- Expected returns to Colac: = 36 cars
Worked example: Three-location system
Consider the transition matrix and diagram for Albury (A), Wodonga (W), and Benalla (B):
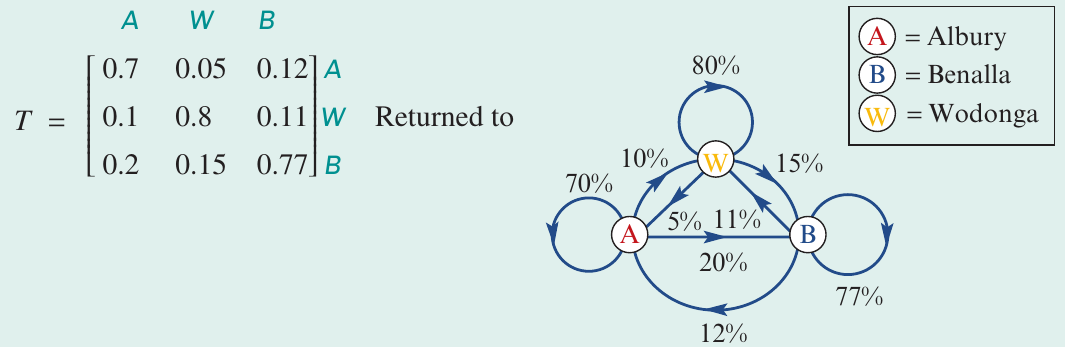
Worked Example: Three-Location System Analysis
Question a: What percentage of cars rented in Wodonga are predicted to be returned to:
- i) Albury?
- ii) Benalla?
- iii) Wodonga?
Solution: Look at column W (Wodonga):
- i) Row A: or 5%
- ii) Row B: or 15%
- iii) Row W: or 80%
Question b: cars were rented in Albury this week. How many are expected to be returned to:
- i) Albury?
- ii) Benalla?
- iii) Wodonga?
Solution: Look at column A and multiply by :
- i) = 140 cars
- ii) = 40 cars
- iii) = 20 cars
Question c: What percentage of cars rented in Benalla are not expected to be returned to Benalla?
Solution: Look at column B. The percentage staying in Benalla is , so:
- Not returning to Benalla:
Alternatively, add the other two entries:
Question d: cars were rented in Albury this week. How many are expected to be returned to either Benalla or Wodonga?
Solution: From column A:
- To Benalla: of cars
- To Wodonga: of cars
- Total: = 48 cars
Alternatively: go elsewhere, so cars
Key features of transition matrices
The column sum rule
In situations where the total number of items remains constant, each column in a transition matrix must sum to exactly 1 (or ). This is because every item must end up in one of the available states.
For example, if of cars stay in Bendigo, then the remaining must go to Colac (assuming only two locations exist). This principle applies to all transition matrices where the total number of items is conserved.
Converting between percentages and proportions
Transition matrices typically use proportions (decimals) rather than percentages:
To convert a percentage to a proportion, divide by .
Matrix notation
A transition matrix is usually denoted by the letter . The general form for a two-state system is:
where and .
Exam tips
Setting up matrices:
- Always label your rows and columns clearly
- Double-check that each column sums to
- Convert percentages to proportions (decimals)
- Use the diagram methodically: complete one column at a time
Interpreting matrices:
- Read carefully whether you're asked for a percentage or an actual number of items
- To find a probability: locate the correct column (starting state) and row (ending state)
- To find expected numbers: multiply the probability by the total number of items
- Show your working clearly, including the multiplication you perform
Common mistakes to avoid:
- Don't confuse rows and columns - remember columns come first (starting state)
- Don't forget to convert percentages to decimals in your matrix
- Don't use percentages when calculating predictions - use proportions
- Don't forget to check that columns sum to
Remember!
Key Points to Remember:
- A transition matrix describes how items move between different states over time
- Columns represent the starting state (where items begin)
- Rows represent the ending state (where items finish)
- Each column must sum to 1 () when the total number of items is constant
- To make predictions, multiply the relevant probability by the number of items in that state
- Always convert percentages to proportions (decimals) when filling in the matrix
- To find "not staying in state X", subtract the staying probability from or add the probabilities of moving elsewhere