Fitting a Trend Line and Forecasting (VCE SSCE General Mathematics): Revision Notes
Fitting a Trend Line and Forecasting
Introduction
When analysing time series data, we often want to understand the overall trend and make predictions about future values. This topic covers how to fit a trend line to time series data using the least squares method and how to use this line to forecast future values.
Learning intentions:
- Use the method of least squares to fit a trend line to a time series
- Use the trend line to make predictions
- Use seasonal indices to add seasonality to predicted values when appropriate
Fitting a trend line
What is a trend line?
When we see a straight-line pattern in our time series graph, we can use the least squares method to fit a line to the data. This line models the underlying trend and helps us understand how the data is changing over time.
The least squares method finds the line of best fit by minimising the squared distances between the data points and the line. This is the same regression technique you've learned in previous topics, but now applied specifically to time series data.
Steps for fitting a trend line
Step 1: Construct a time series plot of your data to confirm the trend appears approximately linear.
Step 2: Use your calculator to fit a least squares regression line to the data. The time variable (e.g., year, quarter) is the explanatory variable (EV) and the measurement (e.g., sales, number of students) is the response variable (RV).
Step 3: Write down the equation of the line, rounding coefficients appropriately (usually to 4-6 significant figures).
Step 4: Interpret the slope in context. The slope tells you the average rate of change per time period.
Worked Example: Fitting a trend line (no seasonality)
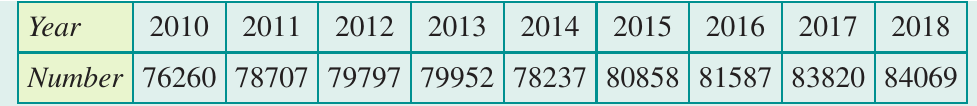
Let's look at data showing the number of female students in Victoria enrolled in at least one Mathematics subject at Year 12 from 2010-2018.
First, we create a time series plot to check if the trend is approximately linear:
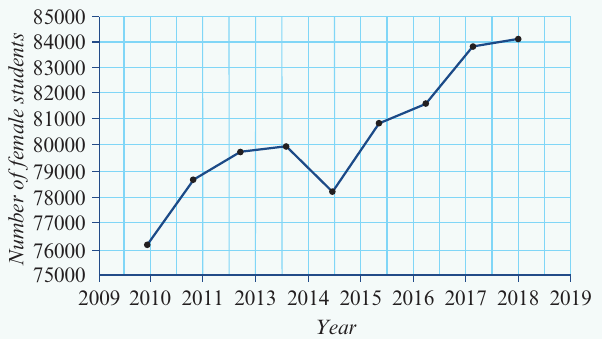
The graph shows an overall upward trend with some fluctuation. The trend appears roughly linear, so we can proceed with fitting a least squares line.
Using a calculator to perform least squares regression, we get:
Interpreting the slope:
The slope is approximately 851 (rounded to the nearest whole number).
This means: Over the period 2010-2018, on average the number of female students in Victoria enrolled in at least one Mathematics subject at Year 12 increased by 851 per year.
Forecasting
What is trend line forecasting?
Trend line forecasting means using our fitted line equation to predict what will happen in the future. We simply substitute the future time value into our equation and solve for the predicted value.
Worked Example: Making a prediction
Using the equation from the previous example, let's predict how many female students will be enrolled in Mathematics in 2026:
Important caution about extrapolation
When making predictions well beyond the range of your original data, treat the results with caution. The further into the future you predict, the less reliable your forecast becomes, because:
- Trends may not continue indefinitely
- New factors might affect the data
- The relationship might not remain linear
Forecasting with seasonality
Why deseasonalise?
When time series data shows a seasonal pattern, we need to remove the seasonal variation before fitting our trend line. This process is called deseasonalising.
The general approach is:
- Deseasonalise the data (divide by seasonal indices)
- Fit a trend line to the deseasonalised data
- Use the trend line to make predictions (these will be deseasonalised values)
- Reseasonalise the prediction (multiply by the appropriate seasonal index)
Worked Example: Fitting a trend line to seasonal data
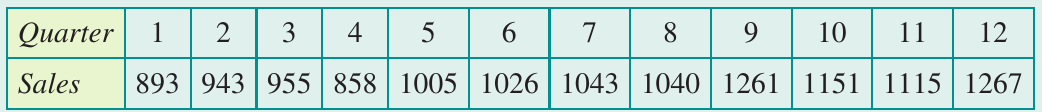
Here's deseasonalised quarterly sales data from Mikki's shop:
We plot the time series and fit a least squares line:
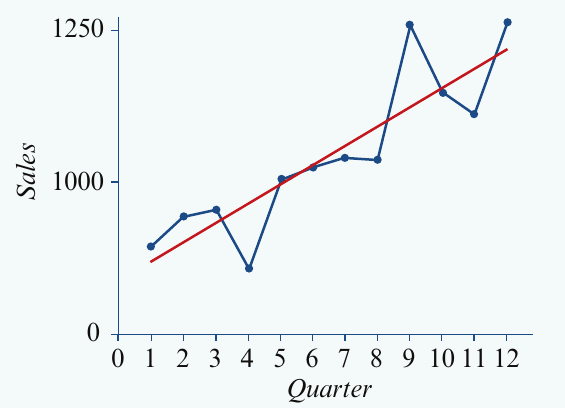
The equation of the trend line is:
Interpreting the slope:
Over the 3-year period, on average sales at Mikki's shop increased by 32.07 sales per quarter.
Making predictions with seasonal data
When you use deseasonalised data to fit a trend line, any prediction you make will also be deseasonalised. You must reseasonalise it to get a meaningful answer.
Worked Example: Forecasting with seasonality
What sales do we predict for Mikki's shop in winter of year 4?
Step 1: Identify which quarter you're predicting.
Since summer year 1 is quarter 1, winter year 4 is quarter 15.
Step 2: Substitute into the trend line equation:
Step 3: Reseasonalise by multiplying by the seasonal index for winter (given as 1.30):
Practice questions
Understanding seasonal indices is important for working with seasonal data. Here are some typical exam-style questions:
Question about electricity costs
The table shows monthly average electricity cost in dollars for a home:
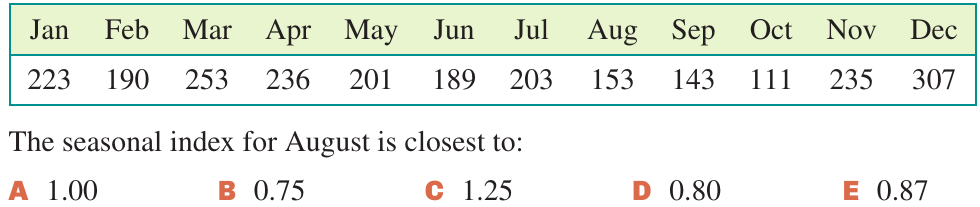
To find the seasonal index for August, you would need to:
- Calculate the overall average
- Find the average for August across multiple years
- Divide August's average by the overall average
Question about hotel occupancy
The table shows room occupancy rates for hotels across different seasons:
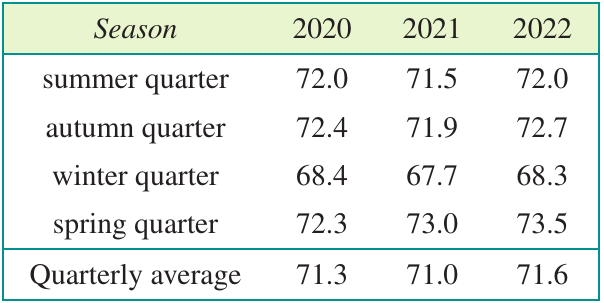
The seasonal index for winter is approximately:

To find this, you would calculate the average winter occupancy and divide by the overall average occupancy.
Remember!
Key Points to Remember:
-
Fitting a trend line: Use least squares regression when you see a linear trend in your time series plot. The slope tells you the average rate of change per time period.
-
Forecasting without seasonality: Simply substitute the future time value into your trend line equation. Remember that predictions far into the future should be treated with caution.
-
Forecasting with seasonality: Follow the DSR process: Deseasonalise the data, fit the trend line, Substitute to get your prediction, then Reseasonalise by multiplying by the appropriate seasonal index.
-
Always interpret in context: When stating your slope or prediction, include the units and explain what it means in the real-world situation.
-
Use appropriate rounding: Coefficients are typically rounded to 4-6 significant figures, but final answers should be rounded sensibly for the context (e.g., to the nearest whole person).