Health Status and Burden of Disease in Different Countries (VCE SSCE Health and Human Development): Revision Notes
Health Status and Burden of Disease in Different Countries
Understanding health variations across countries requires examining key indicators including life expectancy, mortality rates, morbidity patterns and burden of disease. These measures reveal significant differences between high-income countries like Australia and low- or middle-income nations, while also highlighting some important similarities.
Key indicators of health status
Health status varies considerably among the world's 200+ countries. When comparing health outcomes, data is typically presented for:
- The global average
- Australia
- World Bank income groups (high income, upper middle income, lower middle income, and low income countries)
Significant variations exist both within and between countries in each income group, so data represents general patterns rather than uniform experiences. When interpreting health statistics, always consider that individual countries within the same income category may show markedly different outcomes.
Life expectancy trends
Life expectancy has risen dramatically worldwide, more than doubling since 1900. The most substantial improvements have occurred since 2000, benefiting populations across all income levels.
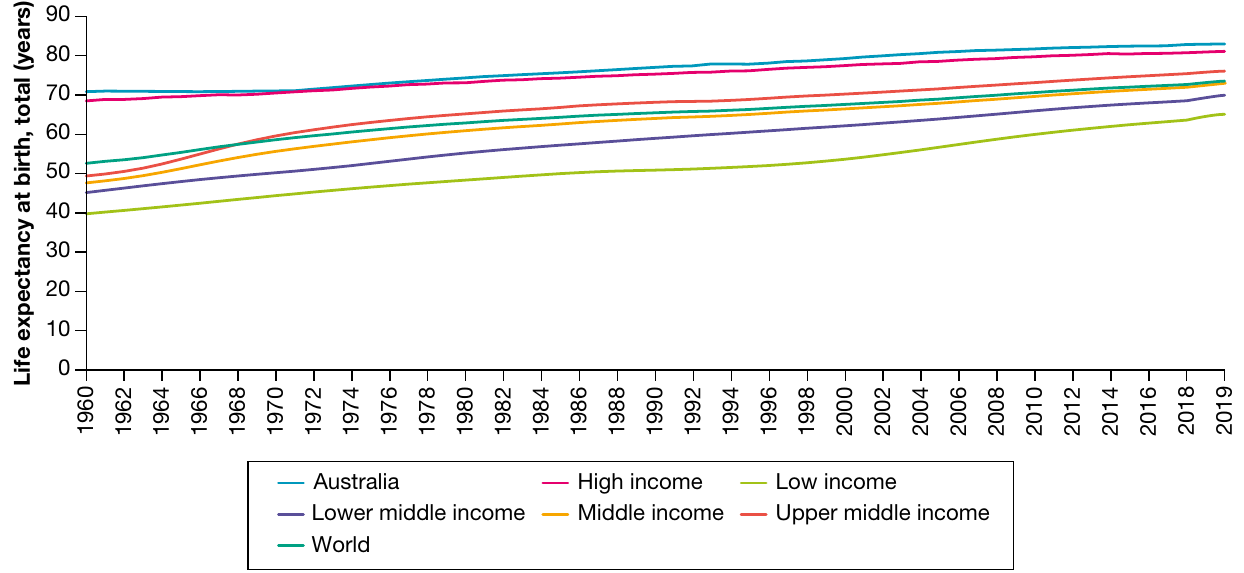
However, life expectancy can fluctuate within countries due to:
- War and conflict
- Spread of infectious diseases
- Economic disruptions
Low- and middle-income countries are particularly vulnerable to life expectancy fluctuations. For example, many African nations experienced significant decreases in life expectancy during the 1990s due to the AIDS epidemic, demonstrating how infectious disease outbreaks can reverse decades of health progress.
Life expectancy by income level
A clear relationship exists between a country's average income and its population's life expectancy. Countries with lower average incomes consistently show shorter life expectancies and reduced health-adjusted life expectancy (HALE).
Health-adjusted life expectancy (HALE) measures the number of years a person can expect to live in good health, rather than simply the total years of life. This indicator provides a more accurate picture of population wellbeing by accounting for years lived with illness or disability.
Think of HALE as "quality years" rather than just "quantity of years" - it's the difference between living to 80 with chronic illness versus living to 75 in good health.
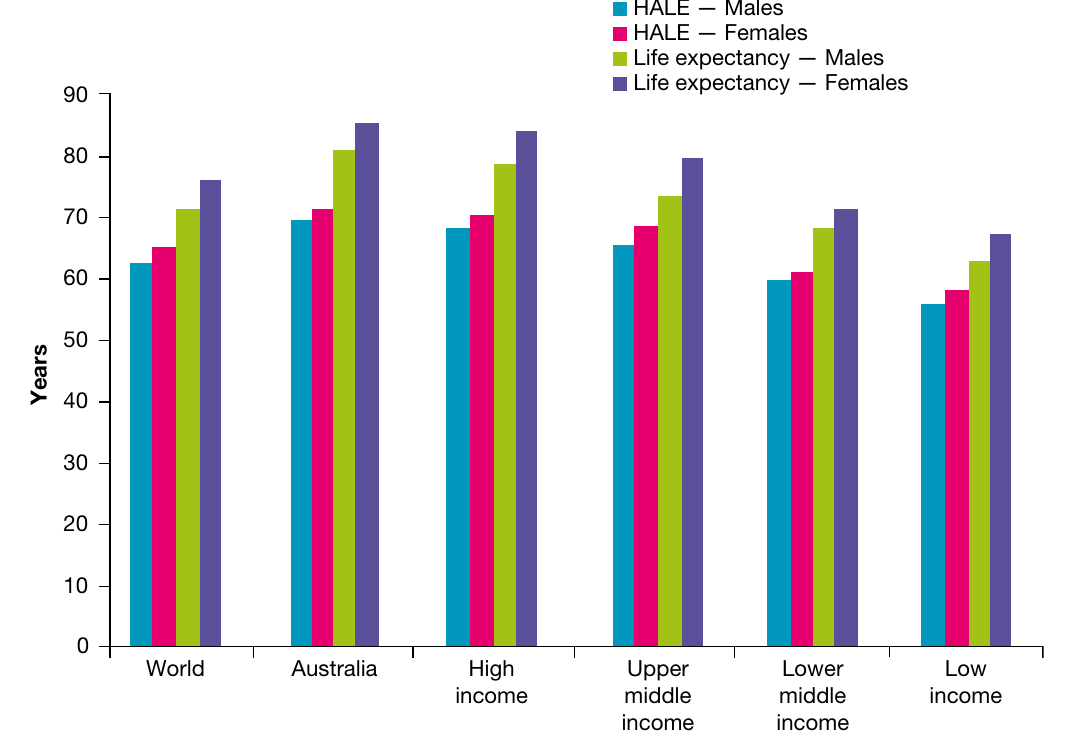
Gender differences in life expectancy
One striking similarity across all countries, regardless of income level, is that females consistently outlive males. This gender gap appears in every country worldwide.
Key statistics:
- Global female life expectancy: 75.6 years
- Global male life expectancy: 70.5 years
- Difference: approximately 5 years
Female life expectancy surpassed male life expectancy globally in the 1970s, and this gap has persisted and even widened slightly, reaching around five years in 2019.
Mortality and morbidity patterns
Mortality rates differ dramatically between countries with varying income levels. These differences stem from multiple factors including healthcare access, nutrition, sanitation and environmental conditions. Understanding these patterns helps identify areas where interventions could reduce health inequalities.
Child mortality and morbidity
The under-five mortality rate (U5MR) serves as one of the most important indicators of a country's overall health status and wellbeing. This measure reflects numerous interconnected factors affecting child survival.
Under-five mortality rate (U5MR) reports the number of deaths occurring in children under five years of age per 1000 live births.
This indicator is considered one of the best measures of overall health system performance because child survival depends on so many interconnected factors - from maternal health to environmental conditions.
Factors influencing child survival
U5MR reflects multiple conditions that affect whether children survive to their fifth birthday:
- Nutritional and health status of mothers
- Health literacy of mothers
- Level of immunisation available
- Availability of maternal and child health services
- Family income and food availability
- Access to clean water and safe sanitation
- Overall safety of the child's environment
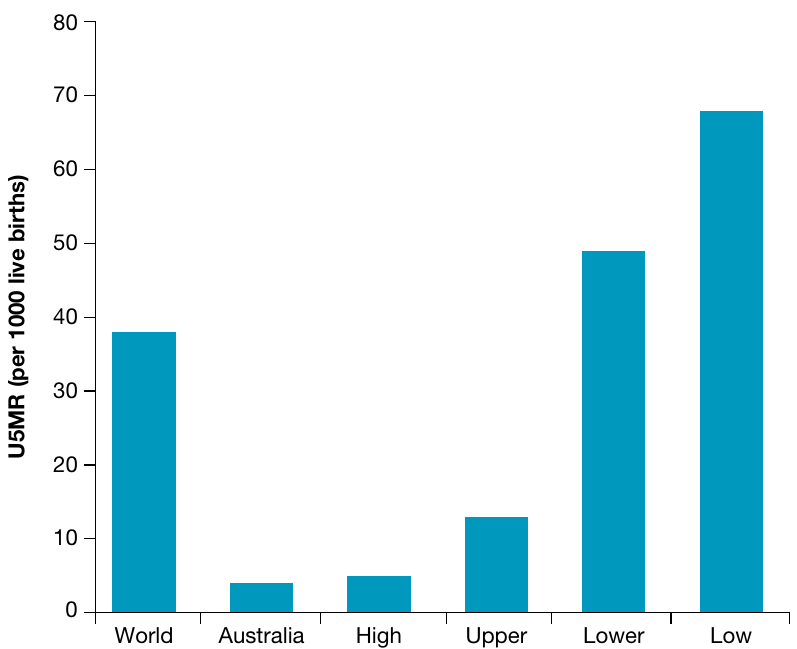
While U5MR has improved in most countries over time, substantial disparities remain. Low-income and, to a lesser extent, middle-income countries experience dramatically higher U5MR compared to high-income countries like Australia.
Critical statistic: In 2019, an estimated 5.2 million children under five died globally - equivalent to more than 10 deaths every minute. Approximately 99% of these deaths occurred in low- and middle-income countries.
This stark statistic highlights the enormous inequality in child survival rates between high-income and low- or middle-income countries.
Causes of child mortality
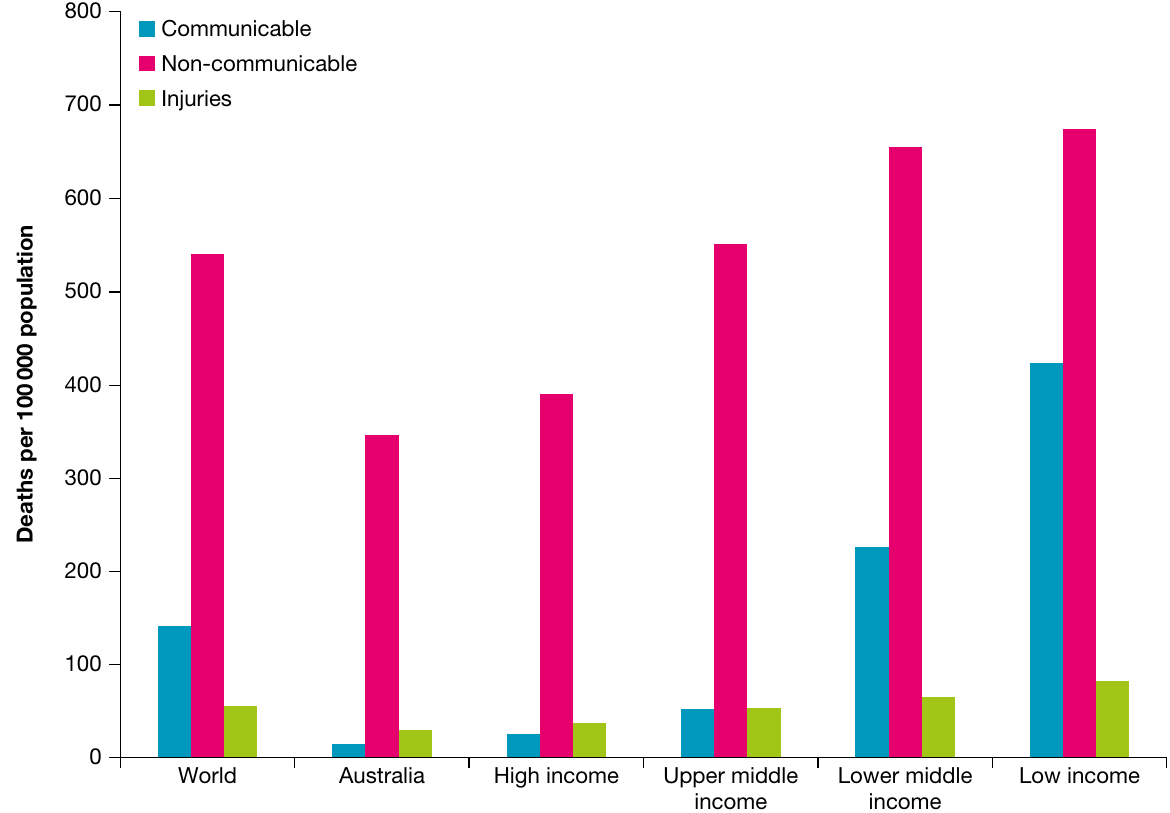
Communicable diseases are infectious diseases transmitted from the environment, including through air, water, food and other infected organisms (including other humans).
Non-communicable diseases are conditions that are usually long-lasting and generally progress slowly. They are not spread through the environment and include cardiovascular disease, cancer, respiratory diseases and diabetes.
Poor nutrition plays a fundamental role in child mortality in low- and middle-income countries. Children experiencing undernutrition develop weakened immune systems, making them far more vulnerable to infectious diseases.
Key communicable diseases causing child deaths in low- and middle-income countries:
- Diarrhoeal diseases
- Malaria (a communicable disease transmitted via infected mosquitoes)
- HIV (Human immunodeficiency virus - an infection causing gradual depletion and weakening of the immune system)
- AIDS (Acquired immune deficiency syndrome - the most advanced stage of HIV infection)
| Condition | World | Australia | High income | Upper middle income | Lower middle income | Low income |
|---|---|---|---|---|---|---|
| Diarrhoeal diseases | 75.5 | 0.28 | 0.48 | 6.7 | 95.7 | 168.7 |
| HIV/AIDS | 7.38 | 0.042 | 0.17 | 3 | 6.6 | 20.7 |
| Malaria | 53.8 | 0 | 0 | 0.45 | 49.2 | 181 |
| Injuries | 31.5 | 6.1 | 9.3 | 23 | 31.6 | 57.2 |
| Prematurity | 100.1 | 12.6 | 21.2 | 46.1 | 129.6 | 135 |
| Birth asphyxia and birth trauma | 85.5 | 10.7 | 6.7 | 22.5 | 112.4 | 152.3 |
| Congenital malformations | 71.5 | 18.7 | 24.5 | 51.7 | 76 | 115.8 |
Under-five mortality rates for selected conditions per 100,000 population, 2019
In contrast, Australian children are more likely to experience mortality and morbidity from:
- Congenital malformations (birth defects)
- Premature births
- Accidental causes such as injuries and poisoning
Adult mortality and morbidity
While child mortality provides valuable insights into a country's health status, adult mortality patterns reveal additional important information. Some countries achieve low child mortality rates but experience high adult mortality, often due to lifestyle factors.
Common causes of elevated adult mortality include:
- Tobacco smoking
- Excessive alcohol consumption
- Unsafe practices leading to HIV/AIDS (unprotected sex, sharing needles for illicit drug use)
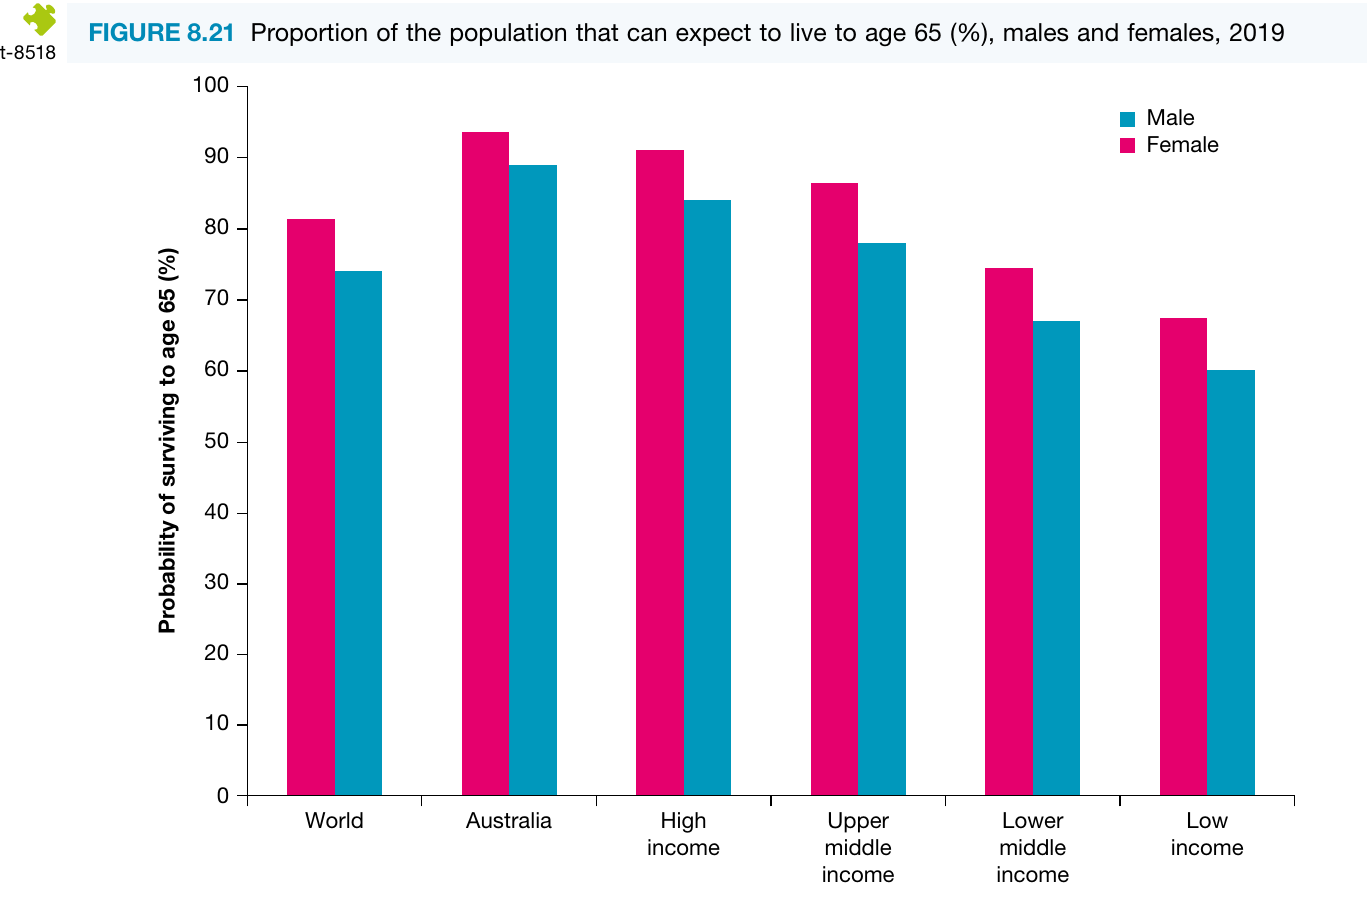
Premature mortality among adults generally increases as average income decreases. The proportion of people expected to survive to age 65 varies significantly by income level.
Disease patterns in adult populations
Both communicable and non-communicable diseases contribute to adult mortality and morbidity differences across income groups.
Major communicable diseases affecting adults:
- HIV/AIDS
- Tuberculosis
- Influenza and respiratory infections
Major non-communicable diseases affecting adults:
- Cancer (neoplasms)
- Cardiovascular disease (heart disease, stroke)
- Type 2 diabetes
- Chronic respiratory diseases
Double burden of disease describes the situation when conditions associated with both poverty and wealth exist side-by-side in one community, such as undernutrition and obesity occurring simultaneously.
This creates a challenging situation where healthcare systems must address both infectious diseases (typically associated with poverty) and chronic diseases (typically associated with wealth) at the same time.
This double burden has emerged in many low- and middle-income countries as non-communicable diseases increase alongside persistent communicable diseases. The rise in non-communicable diseases often accompanies:
- Increasing life expectancies
- Rising rates of obesity
- Changes in diet and physical activity patterns
This dual challenge places enormous strain on healthcare systems that were primarily designed to address communicable diseases. When adults in a family become ill, children may need to provide care, perpetuating cycles of poverty and poor health.
Maternal mortality
Maternal mortality rates provide another crucial indicator of health system performance and women's health status.
Many pregnancy and childbirth complications in low- and some middle-income countries stem from:
- Inadequate healthcare during pregnancy
- Lack of skilled birth attendants
- Limited access to emergency obstetric care
- Poor nutrition and anaemia in mothers
These challenges are rarely faced in Australia, where comprehensive maternal healthcare services are widely available. This difference highlights the critical role that accessible, quality healthcare plays in protecting maternal health.
Burden of disease comparisons
Burden of disease encompasses both mortality (death) and morbidity (illness and disability), providing a comprehensive picture of population health. The primary measure used is disability-adjusted life years (DALY).
DALY combines years of life lost (YLL) due to premature death with years lived with disability (YLD), expressing the total burden of disease in a single number.
Think of DALY as the gap between current health status and an ideal situation where everyone lives to old age in perfect health. It captures both the years lost to dying young and the years spent living with disease or disability.
Low- and middle-income countries experience substantially higher DALY rates compared to high-income countries like Australia. This reflects both higher mortality rates and greater prevalence of diseases causing disability.
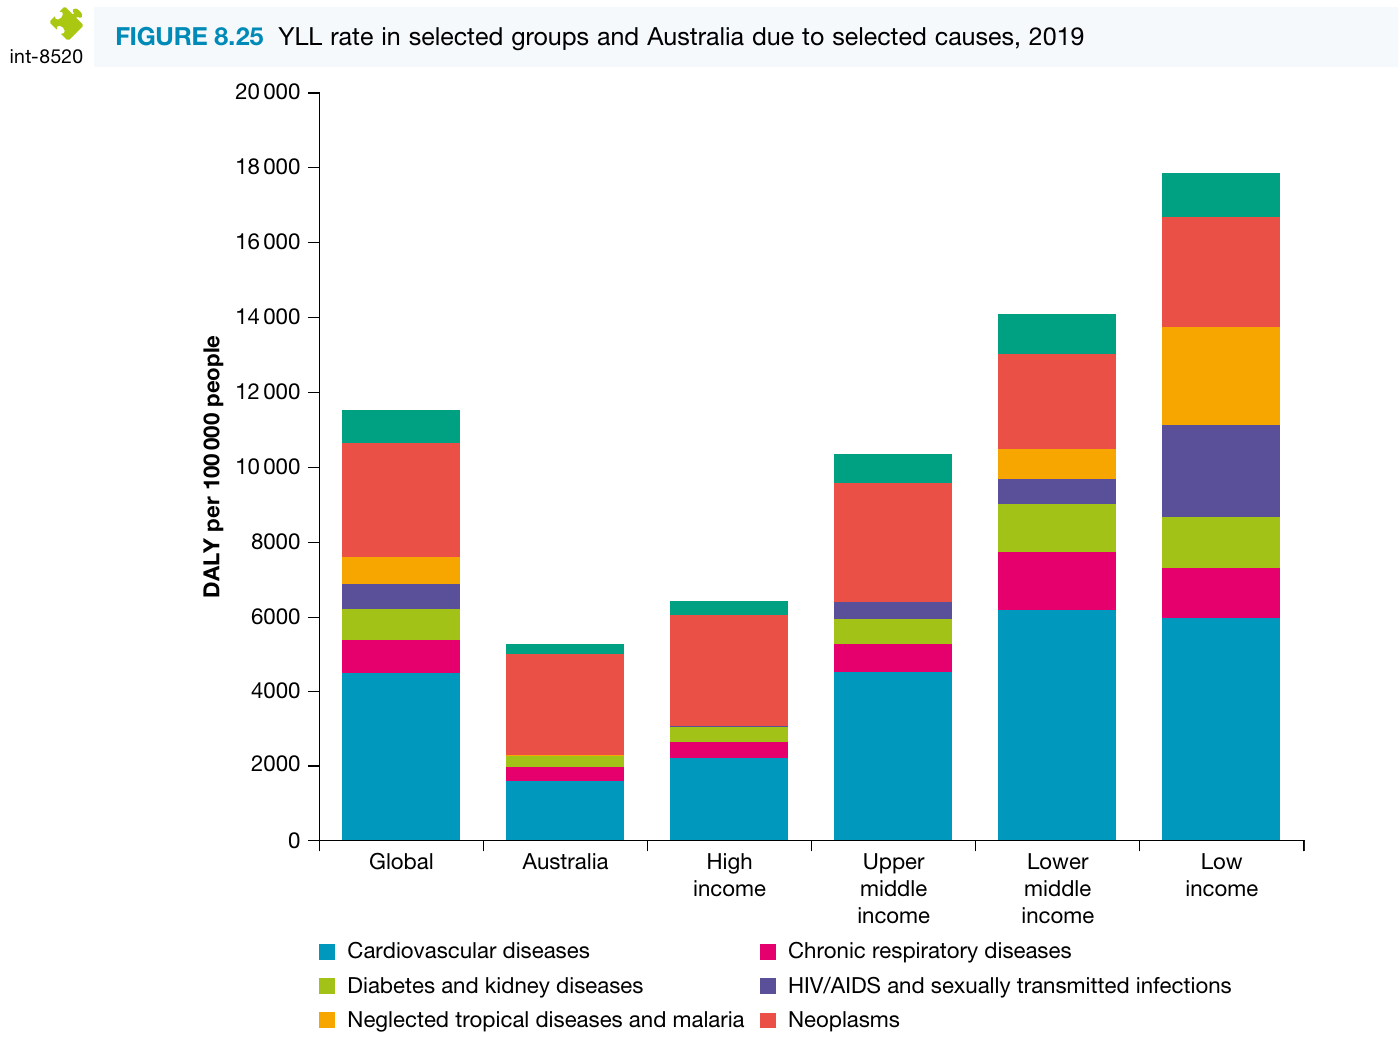
Years of life lost (YLL)
YLL measures the years of life lost when someone dies before reaching the expected life expectancy for their population. Higher YLL rates in low- and middle-income countries result from:
- Higher rates of communicable diseases
- Limited access to effective treatments
- Higher rates of maternal and child mortality
- Injuries and accidents
Australia's well-developed health system enables effective treatment of many conditions that might otherwise cause premature death. This capability extends life expectancy and reduces YLL rates that might otherwise occur. Treatment options are often severely limited in low- and middle-income countries, increasing the risk of premature death and resulting in higher YLL rates.
Proportional contribution to YLL
An important distinction exists between the proportion of YLL caused by different disease types and the absolute rates of YLL.
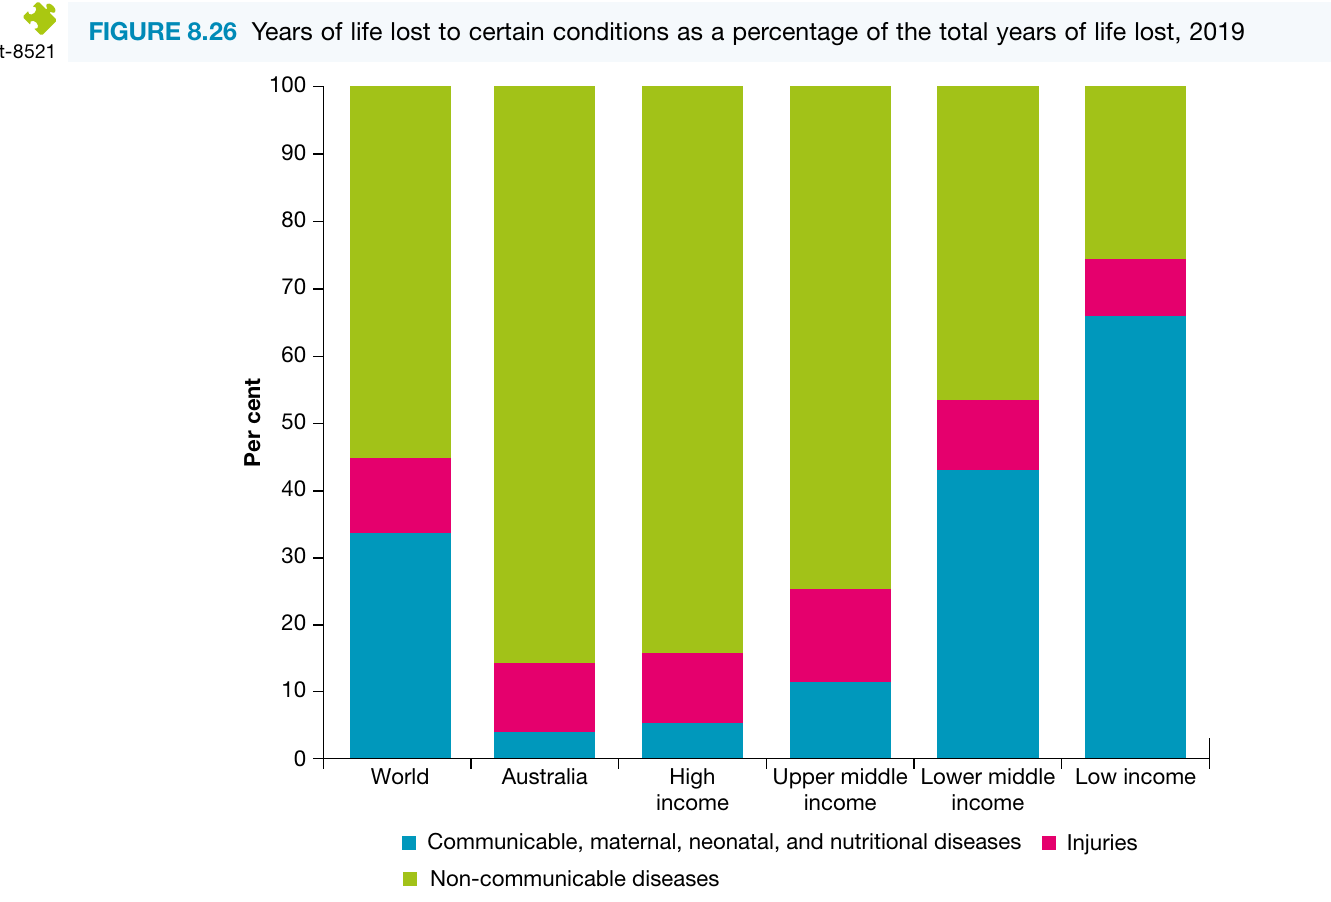
Non-communicable diseases such as cancer and cardiovascular disease cause a higher proportion of YLL in Australia than in low-income countries. However, because overall YLL rates are much higher in low- and middle-income countries, these nations still experience greater absolute rates of YLL from non-communicable diseases than Australia does.
This is a common point of confusion: A disease can represent a smaller percentage of total YLL but still cause more deaths in absolute terms if the overall YLL rate is much higher.
Communicable diseases simply contribute even more to YLL in low- and middle-income countries, making them represent a larger proportion of the total.
Years lived with disability (YLD)
YLD measures the years people live with illness, injury or disability. This component of disease burden has an interesting relationship with life expectancy and healthcare quality.
Effective treatment of diseases in Australia often:
- Reduces YLL by preventing premature death
- Increases YLD as people live longer with chronic conditions
In low- and middle-income countries, diseases more frequently cause death rather than long-term disability, contributing to:
- Higher YLL rates
- Relatively lower YLD rates (compared to the high YLL)
YLD patterns by income level
YLD rates generally increase with life expectancy. When people live longer, they are more likely to experience chronic non-communicable conditions including:
- Cardiovascular disease
- Cancer
- Musculoskeletal conditions (arthritis, osteoporosis)
- Respiratory diseases
- Neurological conditions (dementia)
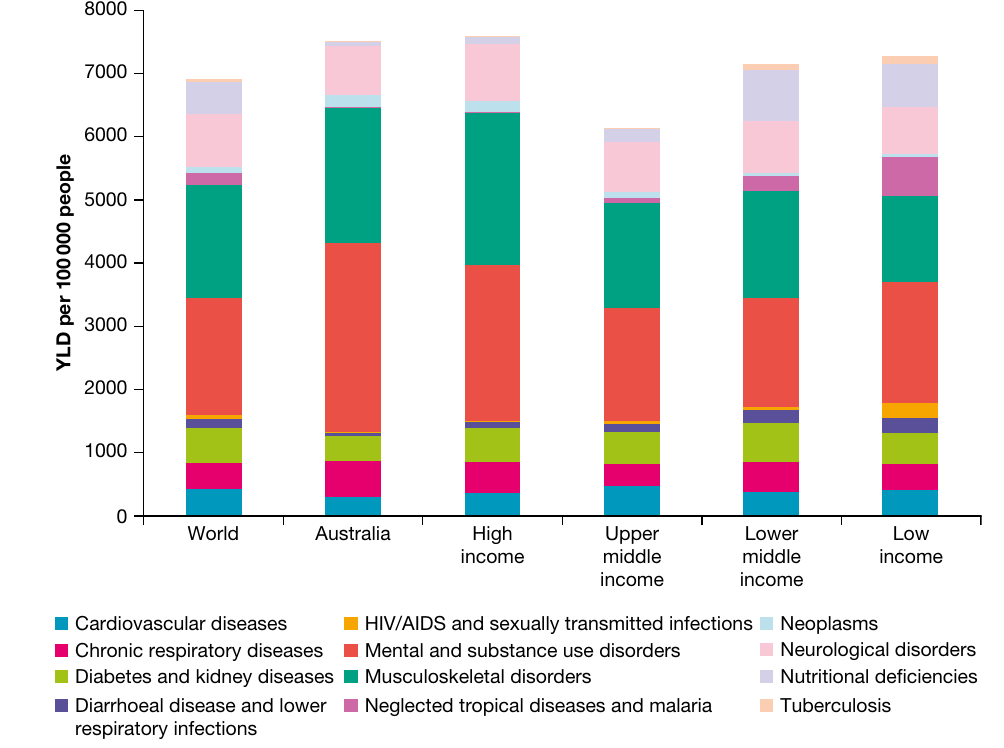
Non-communicable disease rates have increased in many low- and middle-income countries over time, following increases in life expectancy. However, these rates have not yet reached the levels experienced in Australia, partly because a significant life expectancy gap still exists between high-income and low-income countries.
This pattern reflects the epidemiological transition - as countries develop and life expectancy increases, the disease burden shifts from communicable to non-communicable diseases.
Exam tip: When analysing health data, consider both similarities and differences. Differences are often obvious (variations in life expectancy, communicable disease rates, mortality rates). Similarities may be less obvious but are equally important, such as increasing life expectancy in all countries, decreasing under-five and maternal mortality rates worldwide, and increasing obesity rates across many countries.
Key Points to Remember:
- Life expectancy varies significantly by income level, but females outlive males in every country worldwide (global average: females 75.6 years, males 70.5 years)
- U5MR reflects multiple factors including maternal health, immunisation access, healthcare services, family income, clean water and sanitation, and environmental safety
- In 2019, 5.2 million children under five died, with 99% of deaths occurring in low- and middle-income countries
- Low- and middle-income countries face a double burden of disease, with both communicable diseases (malaria, HIV/AIDS, diarrhoeal diseases) and rising non-communicable diseases (cardiovascular disease, cancer, diabetes)
- YLL rates are highest in low-income countries due to premature deaths, while YLD increases with life expectancy as people live longer with chronic conditions
- HALE (health-adjusted life expectancy) provides a better measure of population wellbeing than life expectancy alone, as it accounts for years lived in good health
- The distinction between proportion and absolute rates is crucial when comparing disease burden across countries - a condition may represent a smaller percentage but still cause more deaths in absolute terms