Key Skills (VCE SSCE Health and Human Development): Revision Notes
Key Skills
Introduction
This note covers four essential skills for comparing health status and burden of disease across countries. These skills will help you analyse health data, understand country characteristics, evaluate contributing factors, and explain health inequalities. Each skill requires careful attention to how you use language, interpret data, and explain relationships between factors and health outcomes.
The four key skills covered in this note are:
- Describing characteristics of high-, middle-, and low-income countries
- Evaluating data to analyse similarities and differences between countries
- Analysing factors that contribute to health status and burden of disease
- Comparing health data to analyse health inequalities
Mastering these skills will enable you to make sophisticated comparisons and explain complex health patterns across different countries.
Describing characteristics of high-, middle-, and low-income countries
Understanding how to describe country characteristics
When describing the characteristics of countries in different income groups, you need to consider economic, social, and environmental factors. This skill requires a solid understanding of what makes countries different and how to communicate these differences accurately.
A crucial aspect of this skill is recognising that significant variation exists both within and between countries in each income group. This means you should never make sweeping generalisations that apply to everyone in a particular income group.
Using appropriate comparative language
The way you phrase your descriptions matters enormously. Avoid making absolute statements that suggest a characteristic applies to everyone in a country or income group.
Avoid Absolute Statements
Never say things like "People in low-income countries are not educated" because it implies no-one in these countries has received education, which is clearly untrue. This type of overgeneralisation will lose you marks in assessments.
For example, saying "People in low-income countries are not educated" is incorrect because it implies no-one in these countries has received education, which is clearly untrue. Instead, use comparative language such as:
- "People in low-income countries are less likely to be educated than those in high-income countries"
- "High-income countries experience higher levels of education"
- "Low-income countries have lower rates of literacy"
Phrases like "more likely to", "higher levels of", "experience greater rates of" and their opposites help you make accurate comparisons without overgeneralising.
Providing context in your answers
Your characteristic descriptions must relate directly to the question being asked. Simply stating "education" or "income" doesn't provide enough context.
Adding Context to Your Answers
If asked about a social characteristic of a low-income country, "lower levels of education" is appropriate. For a high-income country, "high levels of education" works well. When comparing two types of countries, make sure to reference both in your answer.
Worked example: Gender equality
Worked Example: Describing Gender Equality Across Income Groups
Let's explore how to describe gender equality across different income groups in detail.
Definition: Gender equality exists when both males and females experience the same opportunities in the society in which they live. This encompasses education, employment, income, and participation in decision-making processes that affect their lives.
In high-income countries: In high-income countries such as Australia, women typically have similar opportunities to men. They can make independent choices about their education and career paths. Women have greater autonomy in determining aspects of their lives.
In middle- and low-income countries: The situation differs significantly in many middle- and low-income countries. Females often face substantial barriers to accessing the same opportunities as males in society. Educational opportunities may be severely limited for girls and women. Many females work in agricultural settings, tending crops, or spend considerable time on daily tasks like collecting water and preparing meals for their families. These responsibilities limit their ability to pursue education or paid employment, perpetuating cycles of inequality.
Key point: Notice how this example uses comparative language throughout and provides specific details to support the comparison between income groups.
Evaluating data to analyse similarities and differences between countries
Understanding data evaluation
This skill centres on your ability to analyse and interpret health data. Data can appear in many formats including tables, maps, charts, infographics, and various types of graphs. You need to become comfortable working with all these formats.
Beyond simply reading data, you must make meaningful statements about health status and burden of disease, identifying both similarities and differences between Australia and middle- or low-income countries. This requires thorough knowledge of health status concepts and burden of disease measures, including understanding how these vary within and between countries.
After evaluating data and making observations, you should explore possible reasons for the similarities and differences you've identified. This takes your analysis deeper, showing you understand the underlying factors at play.
Analysing health data from tables
Tables provide a compact way to compare multiple health indicators across countries. Let's examine how to effectively analyse tabular data using a comparison between Australia and Brazil.
| Indicator | Life expectancy 2019 (Males) | Life expectancy 2019 (Females) | Under-five mortality rate (per 1000 live births) 2019 | Adult literacy rates | Communicable diseases (% of total DALY) | Injuries (% of total DALY) | Non-communicable diseases (% of total DALY) |
|---|---|---|---|---|---|---|---|
| Australia | 81.3 | 84.8 | 3.6 | 99* | 3.34 | 5.74 | 90.92 |
| Brazil | 72.4 | 79.4 | 13.9 | 93 | 12.16 | 11.93 | 75.92 |
*Assumed rate for Australia. Source: WHO, World Bank and IHME data.
Worked Example: Analysing the Australia-Brazil Health Comparison
When analysing this data, start with a general statement about overall health status. The data clearly shows that Australia experiences better health status than Brazil across multiple indicators.
Identifying differences: Looking at specific differences, the under-five mortality rate is considerably lower in Australia (3.6 deaths per 1000 live births) compared to Brazil (13.9 deaths per 1000 live births). This substantial difference suggests children in Australia have much better survival rates.
Explaining the difference: One factor that may explain this difference is the availability of safe water and sanitation. Australia generally has better access to these essential resources compared to Brazil. Young children are particularly vulnerable to diseases like cholera and dysentery, which spread through contaminated water and poor sanitation. These conditions can be fatal for children, contributing to the higher under-five mortality rate observed in Brazil.
Identifying similarities: However, the data also reveals important similarities. In both countries, non-communicable diseases account for the largest proportion of the burden of disease measured in DALYs. In Australia, non-communicable diseases represent 90.92% of total DALYs, while in Brazil they account for 75.92%. Though the percentages differ, both countries face non-communicable diseases as their primary health challenge.
Explaining the similarity: The marketing and availability of processed foods in both Australia and Brazil likely contributes to deaths from non-communicable diseases such as cardiovascular disease and cancer. This shared exposure to processed food marketing helps explain why both countries experience high burdens from these conditions.
Always Support Your Statements with Data
When analysing health data, never make general claims without backing them up with specific figures and appropriate units. For example, don't just say "Australia has lower child mortality" - say "Australia has lower child mortality (3.6 per 1000 live births) compared to Brazil (13.9 per 1000 live births)."
Interpreting line graphs
Line graphs help us understand trends over time. Consider the following graph showing maternal mortality ratios in Australia and Fiji from 1990 to 2017.
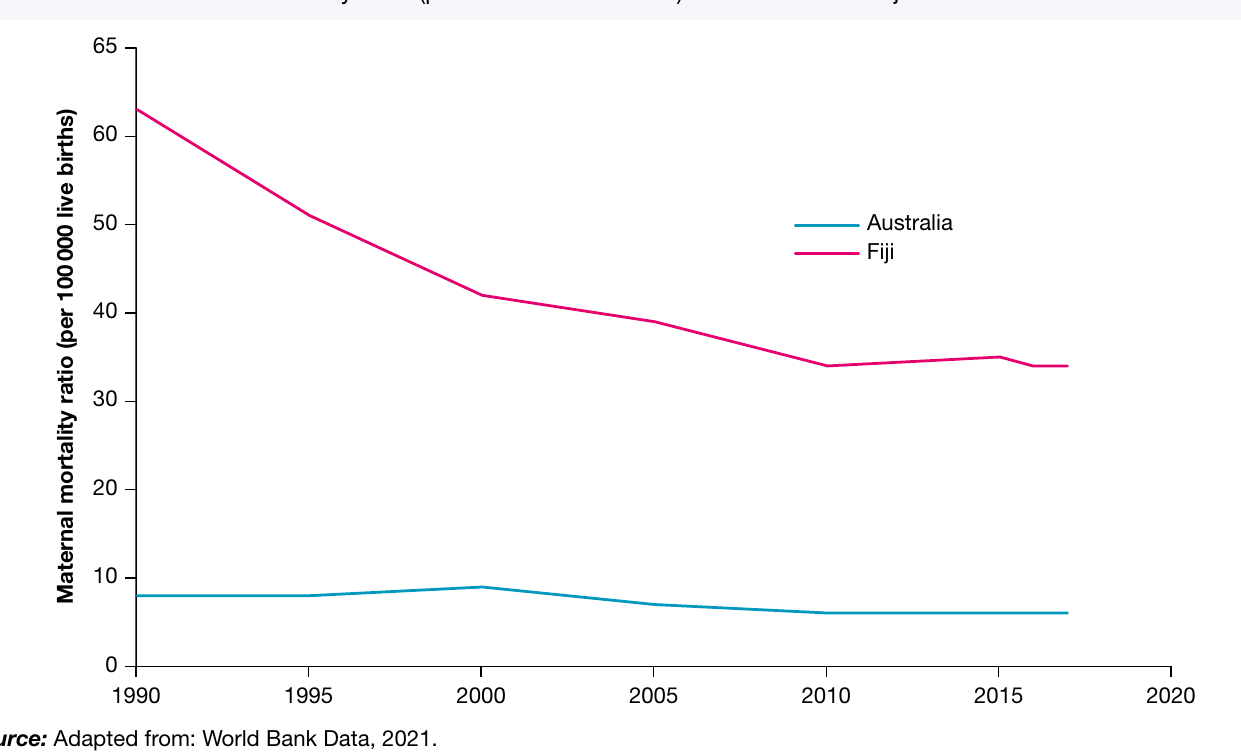
This type of graph allows you to identify both similarities and differences in health trends. Look for patterns in how the lines move over time, note the scale and units used, and compare the values between countries at specific time points.
When analysing this graph, you would identify differences such as the much higher maternal mortality ratio in Fiji compared to Australia throughout the period. You might also note similarities, such as both countries showing a general downward trend in maternal mortality over time, though Fiji's decline is more dramatic while Australia maintains consistently low rates.
Analysing factors that contribute to health status and burden of disease
Understanding the key factors
Several specific factors significantly influence health status and burden of disease, particularly when comparing countries with different income levels. The factors you need to understand are:
- Access to safe water
- Sanitation
- Poverty
- Inequality and discrimination (including race, religion, sex, sexual orientation and gender identity)
- Global distribution and marketing of tobacco, alcohol and processed foods
Understanding these factors means more than just knowing their names. You must be able to explain what each factor involves and how it contributes to health status and burden of disease. Importantly, you need to grasp how these factors explain differences and similarities in health outcomes between Australia and low- or middle-income countries.
Link Factors to Health and Wellbeing Dimensions
This skill also requires you to link each factor to specific dimensions of health and wellbeing, including physical, social, emotional, mental, and spiritual aspects. This demonstrates deeper understanding and is essential for achieving high marks.
Detailed example: Poverty and its impacts
Worked Example: Analysing Poverty as a Contributing Factor
Let's explore poverty as a contributing factor in depth to demonstrate how to analyse these factors effectively.
What is poverty?
Poverty relates to deprivation of resources and often occurs as a result of low income. It can be measured in different ways, each providing different insights.
Extreme poverty measures the proportion of people living on less than US$1.90 per day. This represents the most severe form of poverty, where individuals struggle to meet basic survival needs.
Relative poverty measures the proportion of a population living on less than 50% of their country's average income. This measure recognises that poverty is partly about being unable to participate normally in the society where you live, even if your absolute income exceeds extreme poverty levels.
How poverty contributes to health status and burden of disease
Poverty is much more prevalent in low-income countries compared to high-income countries like Australia. This difference has profound implications for health.
People living in poverty in low-income countries cannot afford products and services that promote health and reduce disease burden. This includes adequate food, access to safe water, and healthcare services. Without these fundamental resources, individuals become more susceptible to various health conditions.
For example, diarrhoeal diseases contribute significantly more to the burden of disease (measured in DALYs) in low-income countries. Under-five mortality and maternal mortality rates are also much higher. These differences directly relate to poverty limiting access to essential health resources.
In contrast, people in Australia generally have higher average incomes, enabling them to afford these health-promoting resources. This helps explain why Australia experiences lower rates of these preventable conditions.
Links to health and wellbeing
Poverty impacts multiple dimensions of health and wellbeing in interconnected ways.
Physical health and wellbeing: From a physical health perspective, poverty often means families cannot afford sufficient food. Inadequate nutrition leads to insufficient energy for daily activities such as attending school or working. This lack of energy to complete basic tasks represents a significant impact on physical health and wellbeing.
Social health and wellbeing: Poverty also affects social health and wellbeing. When families cannot afford school fees or necessary supplies, children miss educational opportunities. This means they cannot interact and socialise with peers their own age, limiting their social development and connections.
Emotional and mental health and wellbeing: The emotional and mental health impacts of poverty are substantial. Living in deprivation can cause significant stress, anxiety and feelings of hopelessness about the future.
Spiritual health and wellbeing: From a spiritual wellbeing perspective, poverty can prevent individuals from participating in activities like education, employment, and recreation. This lack of participation may lead to feelings of disconnection from their community and the world around them. Spiritual wellbeing involves feeling connected to something beyond yourself, and poverty can severely undermine this sense of connection and purpose.
When analysing any of the five key factors, always follow this structure:
- Define or explain what the factor involves
- Describe how it differs between high-income and low-income countries
- Explain how it contributes to health status and burden of disease differences
- Link it to specific dimensions of health and wellbeing with clear explanations
Comparing health data to analyse health inequalities
Approaches to comparing health data
This skill requires you to interpret information and use it to explain reasons for health inequalities. The information you work with might be data (numbers, statistics, graphs) or other formats like case studies and written descriptions.
Whatever form the information takes, your task is to use it to analyse why health inequalities exist within countries and between nations. The information might relate to health outcomes (such as life expectancy or disease rates) or to contributing factors (such as discrimination, poverty, or access to resources).
Example: The relationship between income and child survival
Worked Example: Income and Under-Five Mortality Rates
Let's examine how average income relates to under-five mortality rates across different income groups to understand health inequalities.
Identifying the relationship: Looking at data from the World Bank income groups in 2019, we can observe a clear inverse relationship between average income and under-five deaths. As average income decreases, the rate of deaths among children under five increases substantially.
The data shows:
- In high-income countries, approximately 5 children per 1000 live births die before their fifth birthday
- This rate climbs to around 15 per 1000 live births in upper middle-income countries
- In lower middle-income countries, the rate reaches about 50 per 1000 live births
- Low-income countries experience the highest rates, with approximately 70 deaths per 1000 live births
Explaining the inequality
Why does this stark inequality exist? Several interconnected factors explain the relationship between income and child survival.
Individual purchasing power: Higher average incomes in wealthy countries increase people's capacity to purchase health-promoting resources. Food is particularly important - when families can afford adequate, nutritious food, children develop stronger immune systems. A well-functioning immune system helps fight off infectious diseases, which remain leading causes of death for young children globally.
In contrast, low average incomes in poorer countries prevent many families from accessing sufficient food and nutrition. This weakens children's immune systems, making them more vulnerable to infections that might be easily overcome in better-nourished children. This nutritional factor directly contributes to the much higher mortality rates observed in low-income countries.
Government capacity and infrastructure: Beyond individual purchasing power, average income levels affect what governments can afford to provide. High-income country governments have greater financial capacity to invest in essential infrastructure, including safe water systems and sanitation facilities. These systems protect entire populations, especially vulnerable children, from water-borne diseases.
Governments in low-income countries often lack the resources to install and maintain such infrastructure. Consequently, many children must drink unsafe water, dramatically increasing their risk of contracting diarrhoeal diseases. These diseases represent leading causes of death for children under five, helping explain the stark differences in mortality rates between income groups.
Example: Income and communicable disease mortality
The relationship between income and health inequalities extends beyond child mortality to other health indicators. Consider mortality rates from communicable (infectious) diseases across income groups.
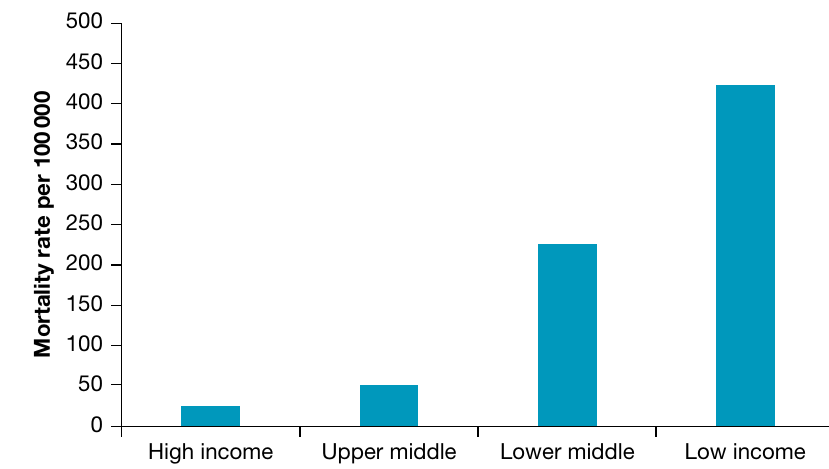
This graph demonstrates another striking inequality. High-income countries experience very low mortality rates from communicable diseases (approximately 20-25 deaths per 100,000 population). Upper middle-income countries have somewhat higher rates (around 50 per 100,000), while lower middle-income countries experience substantially higher rates (approximately 225 per 100,000). Low-income countries face the highest burden, with roughly 420 deaths per 100,000 population from communicable diseases.
This pattern reflects differences in multiple factors including healthcare access, nutrition, sanitation infrastructure, and public health measures. Countries with higher incomes can invest more in preventive healthcare, vaccination programmes, antibiotics, and treatment facilities. They also tend to have better nutrition, cleaner water, and more effective sanitation systems - all of which reduce the spread of infectious diseases.
These examples illustrate how economic factors create substantial health inequalities between nations, with those in poorer countries bearing a disproportionate burden of preventable deaths and diseases.
Remember!
Key Points to Remember:
- Always use comparative language when describing country characteristics - avoid absolute statements that apply to everyone
- When analysing data, support your observations with specific figures and appropriate units
- The five key factors affecting health across countries are: safe water, sanitation, poverty, inequality and discrimination, and marketing of harmful products
- Link factors to specific dimensions of health and wellbeing (physical, social, emotional, mental, spiritual) to demonstrate deeper understanding
- Health inequalities between countries often relate to differences in income, which affects both individual purchasing power and government capacity to provide infrastructure and services
- Practice interpreting different data formats including tables, line graphs, and bar charts - each requires slightly different analysis approaches
- When comparing countries, always reference both countries in your answer and explain the reasons for similarities or differences you identify