Confidence Intervals for the Population Proportion (VCE SSCE Mathematical Methods): Revision Notes
Confidence Intervals for the Population Proportion
Introduction
When we collect data from a sample, our goal is to learn something about the larger population from which the sample was drawn. We know what's in our sample, and we want to use this information to make educated guesses about the population.
Point estimates
A point estimate is a single value used to estimate an unknown population parameter.
The sample proportion can be used as a point estimate for the population proportion . Since this gives us just one value, it's called a point estimate.
Example: Social Media Usage Among Primary School Children
If we survey 200 Australian primary school children and find that 70% use social media, then serves as an estimate of the unknown population proportion (the true proportion of all Australian primary school children who use social media).
Interval estimates and confidence intervals
Why we need interval estimates
The sample proportion changes from sample to sample. Sometimes it will be close to the population proportion , and sometimes it won't be. Using a single value to estimate can be risky.
Because of sampling variability, any single sample proportion may differ from the true population proportion . This is why we need an interval estimate rather than just a point estimate.
What we need is an interval that we are reasonably confident contains the true value of .
Definition: An interval estimate for the population proportion is called a confidence interval for .
The mathematical foundation
When the sample size is large, the sample proportion has an approximately normal distribution with:
- Mean:
- Standard deviation:
By standardising, the distribution of is approximately standard normal (denoted ).
Deriving a 95% confidence interval
For a 95% confidence interval, we want symmetric values around . Using the inverse normal function:
- Upper critical value: (inverse normal of 0.975)
- Lower critical value: (by symmetry)
Therefore:
This means:
After algebraic manipulation, we get:
Making it practical
Since we don't know (that's what we're trying to estimate!), we substitute for in the standard deviation formula. This gives us an approximate 95% confidence interval:
Normal Approximation Requirement
To use this formula, the normal approximation criteria must be met: both and must be greater than 5.
General formula for any confidence level
For a confidence interval:
where is chosen such that
Common confidence levels:
- 90% confidence interval:
- 95% confidence interval:
- 99% confidence interval:
Key terms:
- is the population proportion (unknown)
- is the sample proportion (calculated from our sample)
- is the sample size
Worked example: Comparing confidence intervals
Worked Example: Comparing Different Confidence Levels
Question: Calculate and compare 90%, 95% and 99% confidence intervals for the proportion of primary school children in Australia who regularly use social media, if a random sample of 200 children gives .
Solution:
90% confidence interval:
95% confidence interval:
99% confidence interval:
Visual comparison:
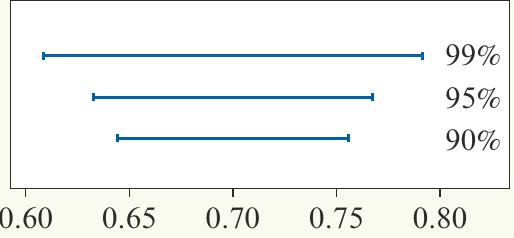
From this diagram, you can clearly see that being more confident (99% vs 90%) requires a wider interval.
Interpreting confidence intervals correctly
Common misunderstanding
Common Mistake
A 95% confidence interval should NOT be interpreted as "there is a 95% probability that lies in this interval." This is incorrect because is a fixed (but unknown) constant – it either is or isn't in the interval.
Correct interpretation
The proper interpretation is: if we repeated this sampling process many times and calculated a 95% confidence interval each time, approximately 95% of those intervals would contain the true population proportion .
Whether any particular confidence interval contains is unknown to us.
Visualising the concept
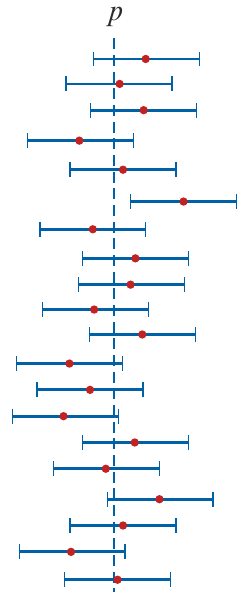
This diagram shows confidence intervals from 20 different samples taken from the same population:
- Each horizontal line represents one confidence interval
- The dots show the sample estimates
- The vertical dashed line shows the true population proportion
- Notice that 19 out of 20 intervals (95%) capture the true value of
- One interval missed (the expected result for 95% confidence)
Key insight: In the long run, 90% of 90% confidence intervals, 95% of 95% confidence intervals, and 99% of 99% confidence intervals will capture the true population proportion.
Using a calculator to find confidence intervals
Worked example: University students
Worked Example: Finding Confidence Intervals with Technology
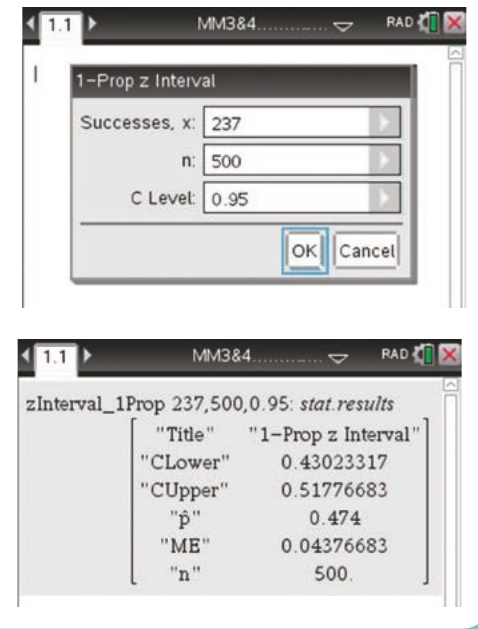
Question: A survey found that 237 out of 500 undergraduate university students questioned intended to take a postgraduate course in the future. Find a 95% confidence interval for the proportion of undergraduates intending to take a postgraduate course.
Using the TI-Nspire:
- In a Calculator page, use Menu > Statistics > Confidence Intervals > 1-Prop z Interval
- Enter: and
- The default confidence level is 0.95 (95%)
- The calculator displays:
- CLower = 0.43
- CUpper = 0.52
The 95% confidence interval is (0.43, 0.52).
Using the Casio ClassPad:
- Go to Statistics menu, then Calc > Interval
- Select One-Prop Z Int
- Enter: C-Level = 0.95, ,
- The calculator displays:
- Lower = 0.4302332
- Upper = 0.5177668
The 95% confidence interval is (0.43, 0.52).
Margin of error
Definition
The margin of error () is the distance between the sample estimate and the endpoints of the confidence interval.
For example, we might say: "We predict 52% ± 2% of people will vote Labor in the next election." Here, the sample estimate is 52%, and the margin of error is 2%.
Formulas for margin of error
For a 90% confidence interval:
For a 95% confidence interval:
For a 99% confidence interval:
Factors affecting margin of error
The margin of error depends on:
- Confidence level: Higher confidence requires larger margin of error
- Sample size (): Larger samples give smaller margin of error
Important: To make an interval narrower (more precise) without changing the confidence level, you need to increase the sample size.
Determining required sample size
Worked example: Sample size calculation
Worked Example: Calculating Required Sample Size
Question: Determine the sample size required to achieve a margin of error of 2% in a 95% confidence interval for the proportion of primary school children in Australia who use social media, if the sample proportion is found to be 0.7.
Solution:
Starting with the margin of error formula:
Substitute and :
Square both sides:
Rearrange to solve for :
Therefore, we need a sample of size 2017 to achieve a margin of error of 2%.
General formula for sample size
Usually, we don't know before taking the sample. Instead, we use an estimated value based on:
- Prior knowledge of the population
- Results from a pilot study
For a 90% confidence interval:
For a 95% confidence interval:
For a 99% confidence interval:
where:
- is the desired margin of error
- is an estimated value for the population proportion
Remember!
Key Points to Remember:
- A point estimate uses a single value () to estimate the population proportion
- A confidence interval provides a range of plausible values for with a specified level of confidence
- The general formula for a confidence interval is: where depends on the confidence level
- Higher confidence levels require wider intervals (99% is wider than 95%, which is wider than 90%)
- The margin of error is the distance from to the interval endpoints; it decreases as sample size increases
- To use these formulas, both and must be greater than 5 (normal approximation requirement)
- A 95% confidence interval means that 95% of such intervals will contain the true , not that there's a 95% probability that any particular interval contains