The Exact Distribution of the Sample Proportion (VCE SSCE Mathematical Methods): Revision Notes
The Exact Distribution of the Sample Proportion
Understanding how sample proportions vary from one sample to another is essential in statistics. We can use probability theory to analyse the behaviour of the sample proportion and develop a deeper understanding of its distribution.
Sampling from a small population
When sampling from a small population, we can calculate exact probabilities for different sample proportions. This approach helps us understand the fundamental concepts before moving to larger populations.
Understanding the sample proportion
Consider a bag containing 6 blue balls and 4 red balls. If we take a random sample of size 4, we are interested in the proportion of blue balls in our sample. The population proportion is:
We can calculate the probabilities for different values of the sample proportion using either direct counting or combinations.
The combination formula counts the number of ways to select objects from objects. This is a fundamental tool for calculating probabilities in sampling without replacement.
The combination formula is:
Worked Example: Finding Probability of One Blue Ball
Question: A bag contains 6 blue balls and 4 red balls. If we take a random sample of size 4, what is the probability that there is one blue ball in the sample ()?
Method 1: Direct counting
When selecting balls one at a time without replacement, the favourable outcomes are RRRB, RRBR, RBRR and BRRR.
The probability is:
Method 2: Using combinations
There are ways to select 4 balls from 10 balls.
There are ways of choosing 3 red balls from 4 red balls.
There are ways of choosing 1 blue ball from 6 blue balls.
Therefore:
Both methods give the same answer, demonstrating the validity of the combination approach.
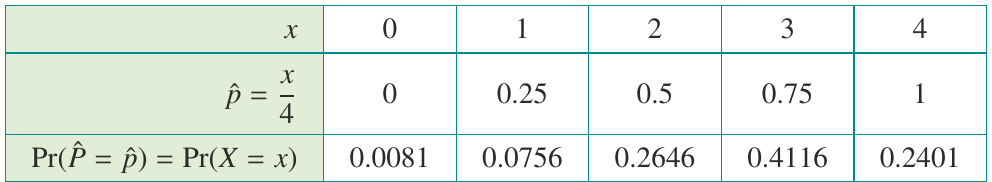
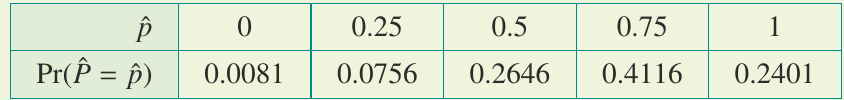
The complete probability distribution
The following table shows the probability of obtaining each possible sample proportion when selecting a random sample of size 4 from the bag:
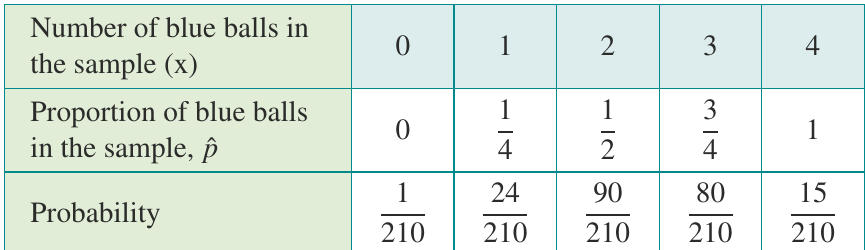
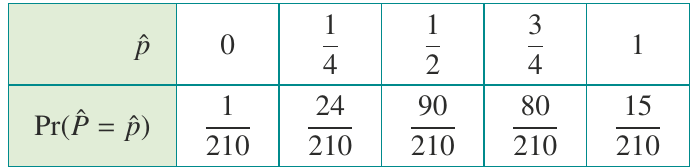
We can treat the sample proportion as a random variable, denoted . This means we can write probabilities such as:
The complete probability distribution can be summarised as:
Key Definition: Sampling Distribution
The distribution of a statistic calculated from a sample (such as the sample proportion) is called a sampling distribution.
This is one of the most fundamental concepts in statistical inference, as it allows us to understand how sample statistics vary across different possible samples.
Worked Example: Using the Sampling Distribution
Question: Using the sampling distribution above, determine the probability that the proportion of blue balls in a sample of size 4 is more than .
Solution:
Sampling from a large population
When sampling from a very large population (such as all people in Australia, or all cows in Texas), we make an important assumption: the probability of observing the attribute of interest remains constant for each selection, regardless of previous selections.
In large populations, the probability barely changes when we remove one individual from the population. For example, selecting one person from Australia's population of millions doesn't significantly change the proportion of any characteristic in the remaining population.
This allows us to treat each selection as independent with constant probability, which leads to the binomial distribution.
Using binomial distributions
Suppose 70% of all 17-year-olds in Australia attend school. That is:
When we select a random sample of size 4, we can use the binomial distribution to calculate probabilities. The probability function is:
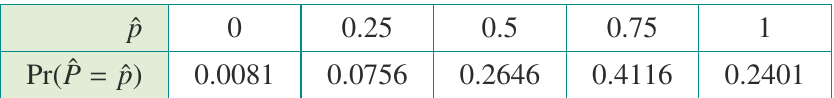
The probability distribution for the sample proportion is:
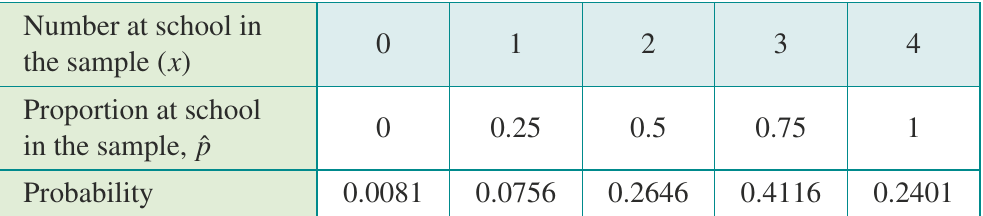
We can summarise this as:
The relationship between and
Since each item in our sample has probability of success, we can define:
where is a binomial random variable with parameters and .
This relationship is shown in the following table:
Key Connection:
The probabilities for the sample proportions correspond exactly to the probabilities for the numbers of successes .
This means we can calculate probabilities about by working with the binomial random variable and then dividing by .
Worked Example: Probability Less Than 50%
Question: Using the sampling distribution above, determine the probability that in a random sample of four Australian 17-year-olds, the proportion attending school is less than 50%.
Solution:
The mean and standard deviation of the sample proportion
Since the sample proportion is a random variable with a probability distribution, we can calculate its mean and standard deviation.
Worked Example: Calculating from the Distribution
Question: Use the probability distribution to determine the mean and standard deviation of the sample proportion from the school attendance example.
Solution:
The mean of is:
For the standard deviation:
First, calculate:
Therefore:
Notice that the mean of the sampling distribution (0.7) equals the population proportion (0.7). This is not a coincidence!
Deriving the formulas
When selecting a random sample of size from a large population, the sample proportion has the form:
where is a binomial random variable with parameters and .
From the properties of binomial distributions:
Using the properties of expectation:
Using the properties of variance:
Key Formulas for Sample Proportion
When selecting a random sample of size from a large population, the mean and standard deviation of the sample proportion are:
These formulas show two critical properties:
- The mean of the sample proportion equals the population proportion
- The standard deviation decreases as sample size increases
Standard Error Definition
The standard deviation of a sample statistic is called the standard error.
Standard error tells us how much variability we expect in our sample statistic across different possible samples. As sample size increases, the standard error decreases, meaning our sample proportion becomes more precise.
Worked Example: Using the Formulas
Question: Use the formulas to determine the mean and standard deviation of the sample proportion from the school attendance example. Are they the same as those found by direct calculation?
Solution:
These values match exactly those obtained by direct calculation from the probability distribution, confirming our formulas work correctly.
Worked Example: Sample Size 20
Question: Suppose that 70% of 17-year-olds in Australia attend school. If a random sample of size 20 is chosen, find:
a) The probability that the sample proportion equals the population proportion (0.7)
b) The probability that the sample proportion lies within one standard deviation of the population proportion
c) The probability that the sample proportion lies within two standard deviations of the population proportion
Solution:
a) If and , then the number of school students in the sample is .
b) First, calculate the standard deviation:
The interval is to .
c) The interval is to .
Notice that the probability increases as we widen the interval. About 78% of samples fall within one standard error, and about 98% fall within two standard errors of the population proportion.
Key Points to Remember:
-
The sampling distribution is the probability distribution of a sample statistic, such as the sample proportion .
-
For small populations, calculate the sampling distribution using combinations: .
-
For large populations, the sample proportion can be expressed as , where follows a binomial distribution with parameters and .
-
The mean of the sample proportion equals the population proportion: .
-
The standard deviation (standard error) of the sample proportion is: , which decreases as sample size increases.
-
Standard error measures the variability of the sample statistic across different possible samples.