Analysing Decay Series Diagrams (VCE SSCE Physics): Revision Notes
Analysing Decay Series Diagrams
Introduction
Earth generates significant internal heat that keeps our planet warm and geologically active. Scientists have measured heat flow from over 20,000 boreholes worldwide and estimate that approximately 44 TW (44 trillion watts) of heat continuously flows from Earth's interior into space. Remarkably, about half of this heat (22 TW) comes from radioactive decay chains occurring within Earth's crust and mantle.

Three naturally occurring decay chains contribute to this heat: the thorium series, the uranium/radium series (from U-238), and the actinium series (from U-235). Each chain releases energy as it progresses through multiple decay stages, eventually ending with a stable lead isotope.
This continuous radioactive decay plays a crucial role in maintaining Earth's molten iron core, which generates our planet's magnetic field and makes Earth habitable. Without this internal heat source, Earth would be a cold, geologically dead planet.
Key definitions
Understanding decay series requires familiarity with several important terms:
Radioactive decay series: The sequence of stages a radioisotope passes through to become more stable. The chain continues until a stable isotope forms.
Parent nucleus: The original decaying nucleus that undergoes radioactive decay.
Daughter nucleus: A nucleus formed by the radioactive decay of another nucleus (the parent). The daughter may itself be radioactive and undergo further decay.
Decay chain: The complete sequence of stages a radioisotope passes through until it reaches a stable nucleus.
Understanding radioactive decay series
The heaviest naturally occurring radioactive elements don't simply decay once and become stable. Instead, they undergo multiple successive decays, forming what we call a radioactive family or decay series. Each decay in the series produces a new isotope, which may itself be unstable and decay further.
Three major decay series include most naturally radioactive elements in the periodic table:
- The uranium series (starting from U-238)
- The actinium series (starting from U-235)
- The thorium series (starting from Th-232)
Common Characteristics of All Decay Series:
Each series shares these essential features:
- A parent isotope with a very long half-life (billions of years)
- Multiple daughter isotopes with varying half-lives
- A stable end-product isotope located on the band of stability
- The final stable isotope in all three series is a lead (Pb) isotope
The uranium-238 decay chain
The uranium-238 decay series provides an excellent example of how decay chains work. This series begins with uranium-238, which has a half-life of years (4.5 billion years).
Worked Example: The U-238 Decay Chain Process
The decay process proceeds through 14 generations as follows:
Step 1: Uranium-238 () undergoes alpha decay to form thorium-234 ()
Step 2: Thorium-234 undergoes beta decay to form protactinium-234 ()
Step 3: Protactinium-234 undergoes beta decay to form uranium-234 ()
Step 4: Uranium-234 slowly undergoes alpha decay (half-life of 245,000 years) to form thorium-230 ()
Step 5: This process continues through multiple stages
Final Step: The decay chain only stops when stable lead-206 () is finally produced at the 14th generation.
How alpha decay affects nuclei in decay chains
When a nucleus undergoes alpha decay, it emits an alpha particle (). This has a predictable effect on the daughter nucleus. Understanding these changes is essential for tracking elements through decay chains.
The daughter nucleus has:
- Two fewer protons than the parent (atomic number decreases by 2)
- Four fewer nucleons than the parent (mass number decreases by 4)
Worked Example: Alpha Decay of Uranium-238
When uranium-238 undergoes alpha decay to become thorium-234:
Analysis:
- The atomic number decreases from 92 to 90 (decrease of 2)
- The mass number decreases from 238 to 234 (decrease of 4)
- The daughter thorium-234 has two fewer protons and two fewer neutrons than the parent
How beta decay affects nuclei in decay chains
When a nucleus undergoes beta decay, it emits a beta particle (), which is a high-energy electron. The process involves a fundamental change within the nucleus itself.
During beta decay:
- One neutron converts to a proton
- The atomic number increases by 1
- The mass number remains unchanged
This means beta decay produces daughter nuclei that move up the periodic table to the next element.
Worked Example: Sequential Beta Decays in U-238 Chain
First beta decay: Thorium-234 undergoes beta decay to form protactinium-234:
Second beta decay: Protactinium-234, which is also a beta-emitter, produces uranium-234:
Key observations:
- In both cases, the atomic number increases by 1
- The mass number stays at 234
- The element changes to the next one in the periodic table
Gamma decay and decay chains
Alpha and beta decay are often accompanied by gamma ray emission. However, gamma rays play a different role in nuclear reactions compared to alpha and beta particles.
For example, when U-238 undergoes alpha decay, two gamma rays of different energies are emitted in addition to the alpha particle:
Why Gamma Rays Don't Appear on Decay Chain Diagrams
Gamma decays are not shown on decay chain diagrams because gamma emission doesn't produce a different nucleus. An excited nucleus (often indicated with an asterisk *) emits a gamma ray but remains the same element and isotope:
Since the nucleus doesn't change identity (same atomic number and mass number), gamma decay doesn't create a new step in the decay chain.
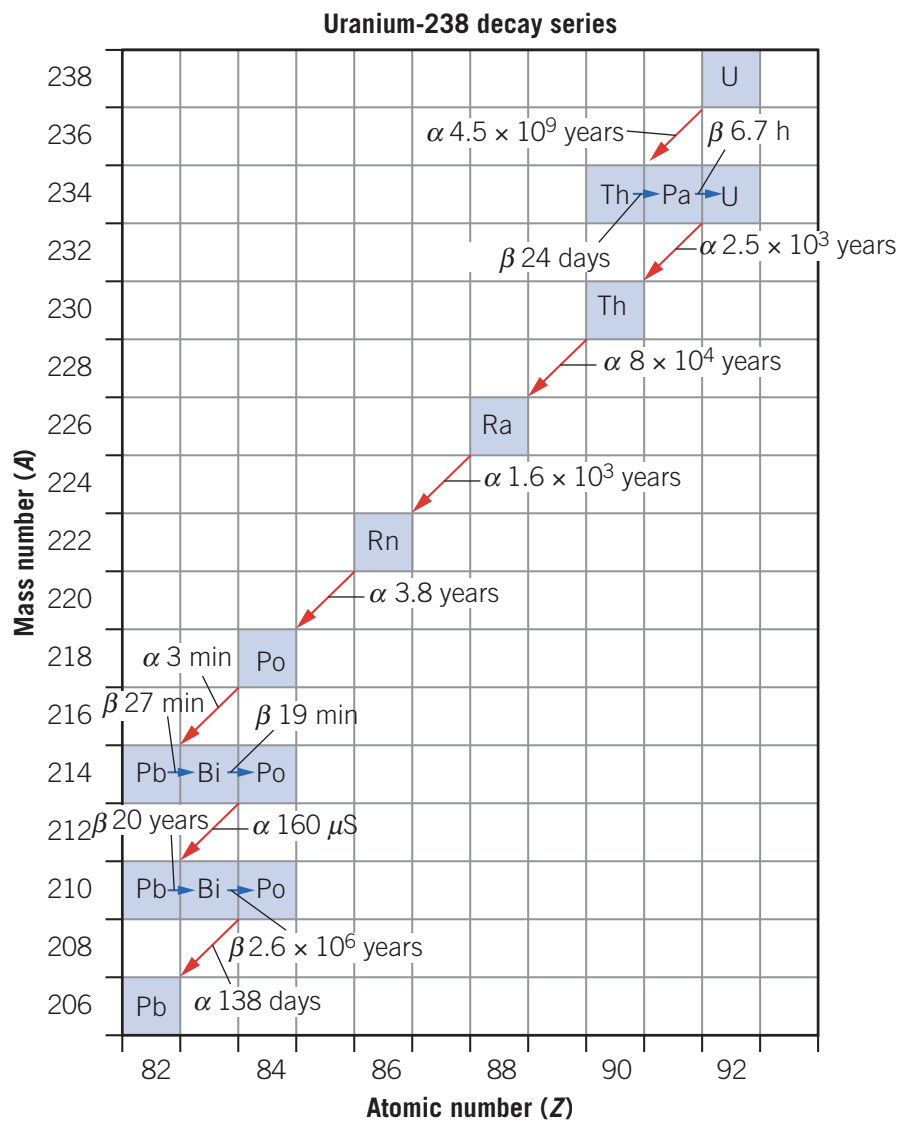
Interpreting decay chain diagrams
Decay chain diagrams are essential tools for visualising radioactive decay series. Understanding how to read these diagrams is a key skill for VCE Physics students. These diagrams contain multiple layers of information that, once decoded, reveal the complete story of a decay series.
Diagram axes
The vertical axis shows the mass number (), while the horizontal axis shows the atomic number ().
For example, uranium-238 appears where and , because uranium-238 is written as .
Memory Aid for Diagram Axes
Remember: "Vertical A, Horizontal Z"
- Vertical = Axis shows mass number
- Horizontal = shows atomic number
Alpha decay arrows
Alpha decays are shown as red diagonal arrows running from upper right to lower left at 45°. These arrows end in a box where:
- The mass number has decreased by 4
- The atomic number has decreased by 2
This makes sense because the alpha particle ejected is .
For example, when radium-226 () undergoes alpha decay, the arrow points to element . Checking the periodic table shows element 86 is radon, correctly shown as on the diagram.
Beta decay arrows
Beta decays are shown as blue horizontal arrows pointing to the right. These arrows end in a box where:
- The mass number is unchanged
- The atomic number has increased by 1
This makes sense because the beta particle ejected is .
For example, when lead-214 () undergoes beta decay, the arrow points to element . Checking the periodic table shows element 83 is bismuth, correctly shown as on the diagram.
Half-life information
Decay chain diagrams also provide the half-life () for each decay step. This information reveals the relative stability of each nucleus in the chain.
Half-lives are given in various units depending on their magnitude:
- Years (for very long half-lives)
- Days
- Hours (h)
- Minutes (min)
- Seconds (s)
- Milliseconds (ms)
- Microseconds (μs)
Examples of Half-Life Variation in U-238 Chain:
- Uranium-238 has years (very stable, comparable to Earth's age)
- Polonium-214 has μs (decays almost instantly)
This wide range of half-lives reflects the varying stability of different nuclei in the decay chain. Some nuclei are relatively stable and persist for billions of years, while others decay in fractions of a second.
Key Points to Remember:
-
Decay series consist of successive radioactive decays starting from a long-lived parent nucleus and ending with a stable isotope
-
Alpha decay reduces the atomic number by 2 and mass number by 4, shown as diagonal red arrows pointing down-left on decay diagrams
-
Beta decay increases the atomic number by 1 while mass number stays constant, shown as horizontal blue arrows pointing right on decay diagrams
-
All three natural decay series (uranium, actinium, and thorium) end with stable lead isotopes
-
Decay chain diagrams plot mass number (vertical axis) against atomic number (horizontal axis), with arrows showing decay type and half-lives labeled on each transition
-
Memory aid: "Red diagonal = alpha, Blue horizontal = beta"