Analysing and Evaluating Data (VCE SSCE Psychology): Revision Notes
Analysing and Evaluating Data
Introduction to analysing data quality
Before researchers can draw conclusions from an investigation, they must evaluate both the quality and quantity of evidence collected. This evaluation is essential because research evidence forms the basis for making important decisions and advancing scientific understanding. Data quality analysis examines several dimensions: true value, accuracy, precision, repeatability, reproducibility, validity, errors, certainty, outliers, and the presence of contradictory or incomplete data.
Understanding these concepts allows researchers to determine how reliable and trustworthy their findings are, and whether those findings can be applied more broadly beyond the immediate study.
The quality of research evidence directly impacts the credibility of scientific conclusions. Each dimension of data quality—from accuracy to outliers—provides a different lens through which to evaluate whether research findings can be trusted and applied.
Core concepts in data quality
True value
The true value represents the perfect measurement that would be obtained if a quantity could be measured with absolute precision and without any error. This theoretical ideal would require zero error when using measurement instruments, collecting data, processing results, and reporting findings.
In practice, obtaining a true value is rarely possible because all measurements carry some degree of uncertainty. However, researchers can sometimes calibrate their instruments against known true values to assess measurement quality.
Practical Examples of True Value Calibration
- Biometric technology designed to estimate age can be validated against the known true value documented on a person's birth certificate
- A new timepiece can be tested for accuracy against Coordinated Universal Time, the internationally recognised standard
These examples show how researchers use established standards to approximate true values in their measurements.

Accuracy
Accuracy describes how closely a measurement approaches the true value of what is being measured. In psychology research, accuracy is assessed qualitatively rather than quantitatively. Researchers describe measurements using terms such as 'more accurate' or 'less accurate', or classify them as good, 'expected', or 'poor'.
A measurement is considered accurate when it closely approximates the expected true value. Researchers can evaluate accuracy by repeating their measurements and examining how consistently close the results remain to the true value.
Worked Example: Evaluating Accuracy
Consider a student whose true height is 172 cm. If they measure themselves as 176 cm using a small ruler, this measurement lacks accuracy.
How to verify: The student could take several more measurements to determine whether:
- The results consistently deviate from the true value (suggesting a systematic problem)
- The initial measurement was an isolated error (suggesting a one-time mistake)
This process of repeated measurement helps distinguish between consistent inaccuracy and random variation.
Precision
Precision refers to how closely a set of measurements cluster together, regardless of their proximity to the true value. It indicates consistency and exactness within a dataset collected under identical conditions.
Critical Distinction: Precision vs Accuracy
Precision differs fundamentally from accuracy because precision does not require reference to the true value:
- A set of measurements can be highly precise (closely grouped together) whilst being inaccurate (far from the true value)
- Conversely, measurements can be accurate on average but imprecise (widely scattered)
- Both precision and accuracy can be compromised by different types of errors
Worked Example: Assessing Precision
If a refrigerator thermometer is checked daily for a week and yields the following temperatures:
3.1, 3.2, 3.1, 3.1, 3.2, 3.2, 3.1°C
Analysis: These results demonstrate high precision because:
- The values are tightly clustered (ranging only from 3.1 to 3.2°C)
- The measurements are consistent across the week
- This precision exists even if we don't know whether they accurately reflect the true temperature
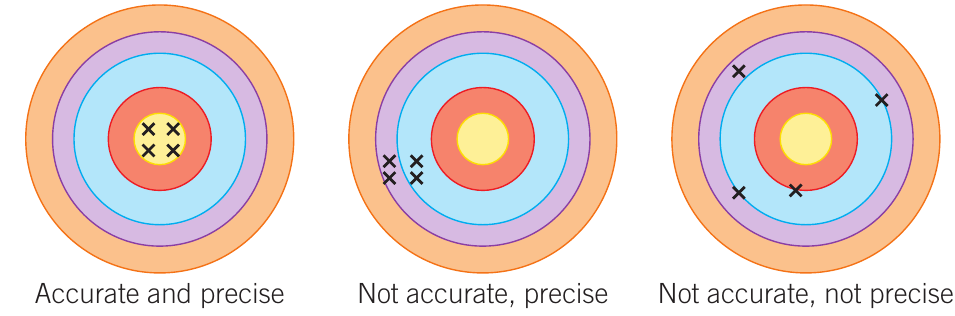
The diagram above illustrates the critical distinction between accuracy and precision:
- Left target: Measurements are both accurate (centred on the true value) and precise (tightly grouped)
- Middle target: Precision without accuracy—the measurements cluster together but miss the centre
- Right target: Neither accurate nor precise, with measurements scattered across different areas
Verifying research findings
Repeatability
Repeatability measures how closely successive measurements of the same quantity agree when carried out under identical conditions. This concept is fundamental to verifying research findings.
When measurements can be successfully repeated by the same investigator using the same methodology, instruments, location, and timeframe, the study's results can be verified and confirmed as genuine findings. Poor repeatability suggests flaws in the measurement process or instrument.
Example: Testing for Repeatability
Consider an intelligence test administered to a participant on two separate occasions. If the test produces substantially different results each time, this inconsistency indicates potential problems with the test itself.
Key requirement: For research findings to be meaningful and trustworthy, studies must demonstrate repeatability, yielding consistent results whenever repeated under the same conditions.
Reproducibility and replicability
Reproducibility assesses how closely measurements of the same quantity agree when carried out under different conditions. This includes variations in the researcher conducting the study, the measurement method employed, the instruments used, the location, timing, or cultural context.
Reproducibility provides another crucial method for verifying research findings. When a different research team can obtain similar results using different methods, instruments, or settings, the original findings gain credibility and can be confirmed as genuine.
If one research team reports specific findings but a second team conducting a similar investigation obtains completely different results, the original findings lack reproducibility. This discrepancy might indicate an error in one study or an undetected methodological difference that requires investigation before determining the research's overall credibility.
Replicability is a related concept applied when different studies aim to answer the same scientific question using their own distinct methods and data. Research is considered replicable when independent studies using different approaches yield the same answer to the research question. Studies lacking replicability face questions about their credibility.
Key Requirement for Research Credibility
For research findings to carry weight, they should demonstrate both:
- Reproducibility: Same findings with different methods and researchers
- Replicability: Same answer when studies use their own independent approaches
Without both, the reliability of research conclusions remains questionable.

The image above illustrates reproducibility in action: measuring an athlete's performance in both controlled pool conditions and natural open water environments provides different testing conditions that can verify whether performance measures are reproducible.
Validity of measurements
What is validity?
Validity addresses whether a measurement actually measures what it claims to measure. In psychological research, validity operates at two levels: the validity of individual measurements and the validity of entire investigations.
Internal validity
Internal validity examines whether a study genuinely investigates what it claims or sets out to investigate. Multiple factors can compromise internal validity, including inappropriate research design, flawed sampling and allocation techniques, and the influence of extraneous and confounding variables.
Example: Intelligence Testing
An intelligence test should measure intelligence specifically, not other related traits such as memory capacity or educational background.
Consequence of poor internal validity: When a study lacks internal validity—perhaps because confounding variables have influenced the results—the findings may not represent genuine effects. This means researchers cannot draw valid conclusions from the study.
Critical Relationship: Internal vs External Validity
If internal validity is absent, external validity becomes irrelevant because the study hasn't successfully measured what it intended to measure in the first place. You must establish internal validity before external validity has any meaning.

The image above shows fingerprint authentication technology on a mobile phone, which represents a valid measurement of authentication—it accurately recognises a specific fingerprint before granting access to the device.
External validity
External validity concerns whether research findings can be applied to similar individuals in different settings beyond the original study population. This relates to the generalisability of results.
Example: Cultural Bias in Testing
Consider an intelligence test that accurately measures intelligence in white, middle-class individuals. If this test fails to account for cultural diversity, it demonstrates bias and cannot validly assess intelligence across the wider, diverse population. Such a test would lack external validity.
External validity can be strengthened through sampling techniques with broad inclusion criteria, ensuring the sample represents not only the specific population of interest but also the broader general population. Without external validity, research findings cannot be generalised to individuals who differ from the original study participants.

Informal personality tests are often found in magazines. These typically lack validity because they do not genuinely measure personality traits—they merely identify preferences.
Understanding errors in research
Personal error
Personal errors encompass mistakes, miscalculations, and observational errors made during the research process. These are human errors rather than flaws in instruments or methodology.
Example: Observational Personal Error
A researcher observing parent-child responses during an immunisation procedure might incorrectly record the times when the child was crying. This represents a personal error—a mistake made by the observer in recording behaviour.
How to Handle Personal Errors
Personal errors must be addressed by repeating the investigation correctly. These errors should be excluded from data reporting and analysis because they don't represent genuine measurements but rather mistakes in the research process.

Measurement error
Measurement error represents the difference between a measured value and the true value being measured. Researchers must consider two distinct types of measurement error when evaluating data quality: systematic errors and random errors.
Systematic error
Systematic errors compromise measurement accuracy by causing readings to deviate from the true value by a consistent amount (or consistent proportion) every time a measurement is taken. All readings shift in one direction from the true value.
These errors can originate from observational error, imperfect instrument calibration, or environmental interference. For instance, a thermometer might consistently measure temperature one degree higher than the true value on every occasion it is used.
Critical Characteristic of Systematic Errors
A defining characteristic of systematic errors is that repeating measurements cannot improve accuracy because the error persists throughout all measurements. Continuing to use the miscalibrated thermometer will not improve measurement accuracy.
How to minimise: Systematic errors can be minimised by understanding instrument limitations and developing proper experience with correct instrument use.
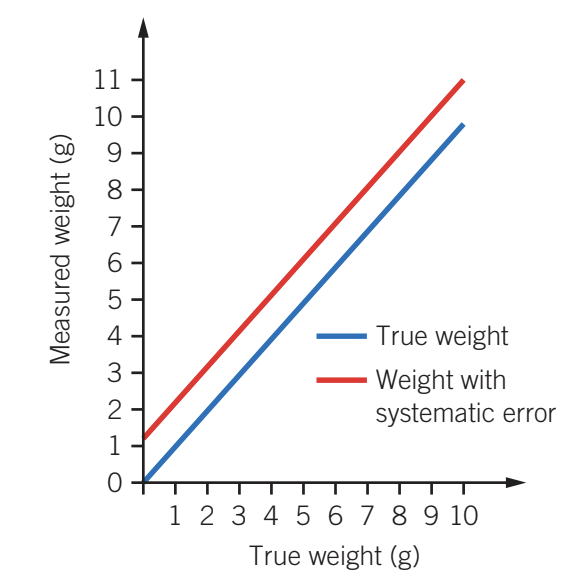
The graph above demonstrates systematic error: the red line showing measured weight consistently sits above the blue line representing true weight. Each measurement is shifted upwards by a constant amount, illustrating the consistent bias characteristic of systematic error.
Random error
Random errors affect measurement precision by introducing unpredictable variations in the measurement process, resulting in scattered readings. These errors are present in all measurements except those involving simple counting, and they don't follow predictable patterns—each measurement differs slightly from the next in unpredictable ways.
Random errors may arise from instrument limitations, environmental factors, or slight procedural variations. For example, if a person stands in slightly different positions on a scale each time their weight is measured, this can produce small variations in the recorded weight.
Reducing Random Errors
Unlike systematic errors, random errors can be reduced through several strategies:
- Making more measurements
- Calculating a new mean from multiple readings
- Increasing sample size
- Refining the measurement method or technique
These approaches improve precision by averaging out the unpredictable variations.
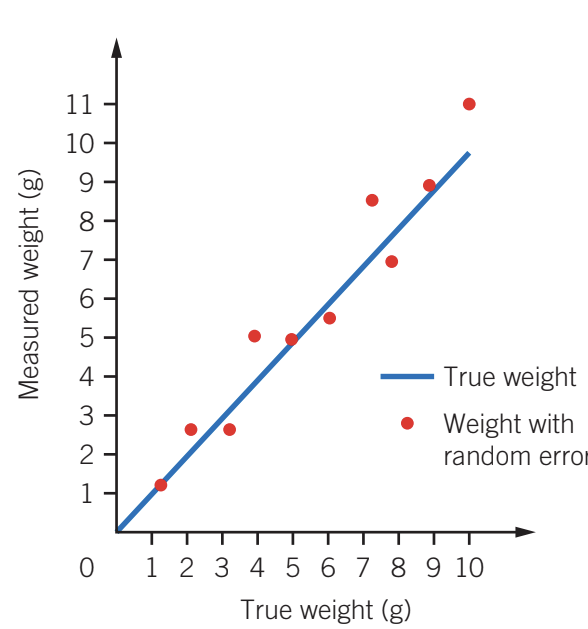
The graph above illustrates random error: the red dots representing measured weight scatter around the blue line showing true weight. The measurements vary unpredictably above and below the true value, demonstrating the spread of readings characteristic of random error.
Uncertainty in measurements
Uncertainty refers to the fundamental lack of exact knowledge about the value being measured. All scientific research aims to reduce the degree of uncertainty surrounding observations, relationships, and causes.
All measurements carry some uncertainty and have multiple potential sources of variation. This uncertainty extends beyond individual measurements to all inferences and conclusions based on those uncertain measurements. In psychology, the nature of human behaviour and mental processes often involves abstract constructs that inherently increase measurement uncertainty.
Uncertainty vs Error: A Critical Distinction
Uncertainty differs from error. In SSCE Psychology, uncertainty does not require quantitative calculations. Instead, a qualitative treatment of uncertainty involves evaluating data to identify:
- Contradictory data: Incorrect values
- Incomplete data: Missing values, such as unanswered questions or unobserved variables, including potential sources of bias
All measurements possess some degree of uncertainty, and assessing this requires the observer's judgement about data quality and completeness.
Identifying and handling outliers
Outliers are values that lie far from other results in a dataset. These unusual readings can occur by chance in any dataset and may represent genuine values, or they may result from measurement errors, recording mistakes, skewed distributions, or data points from a different underlying distribution.
A small number of outliers are expected in larger samples, and their mere presence doesn't automatically suggest a problem. Researchers may find it useful to repeat measurements to explore whether an outlier represents a genuine finding or an error.
Critical Approach to Outliers
In SSCE Psychology, data visualisation techniques are used to identify potential outliers in datasets. Critically, outliers must be analysed and properly accounted for rather than automatically dismissed.
Researchers must consider:
- How outliers might affect their analytical efforts
- The overall validity of their research findings
- Whether the outlier represents a genuine phenomenon or measurement error
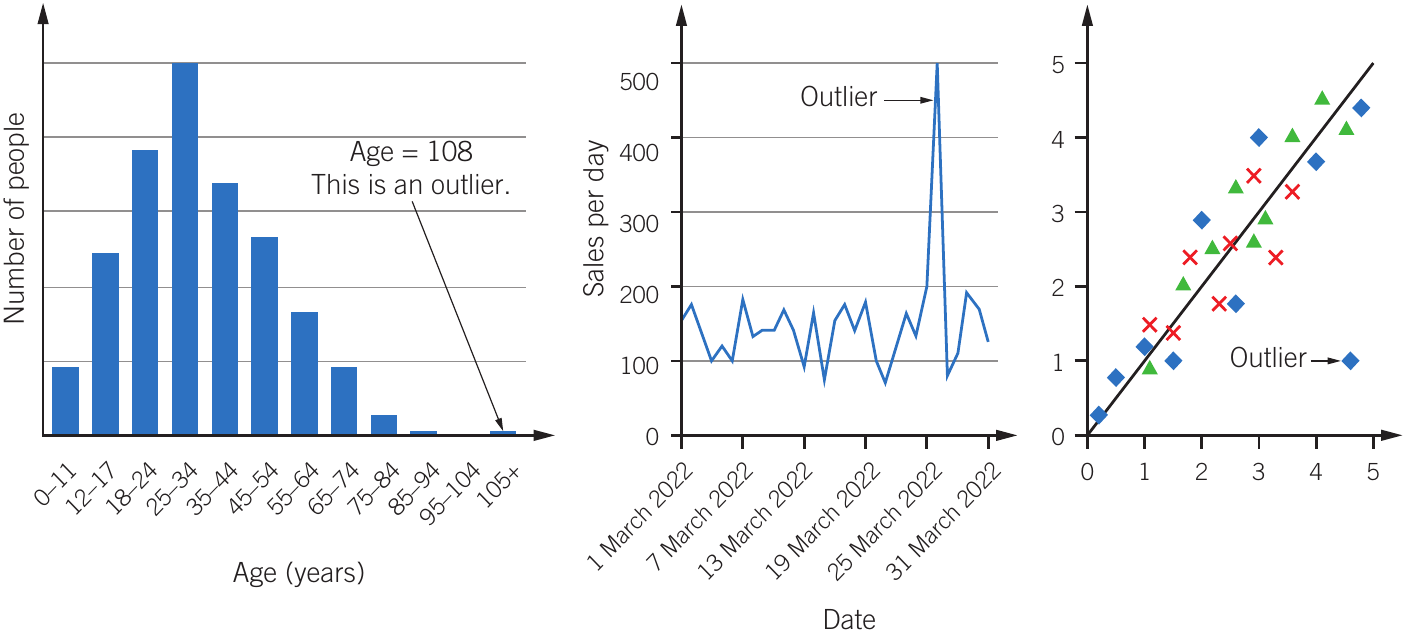
The figure above demonstrates outliers in different types of data visualisation. The left panel shows an age distribution where 108 years represents an outlier. The middle panel displays a time series where one day's sales spike dramatically above normal levels. The right panel presents a scatter plot where one data point falls far from the general trend line. Each visualisation method reveals outliers in different ways, highlighting the importance of appropriate data presentation for identifying unusual values.
Remember!
Key Points to Remember:
-
Quality over quantity: Before drawing conclusions, always evaluate both the quality and quantity of collected evidence by examining true value, accuracy, precision, repeatability, reproducibility, validity, errors, uncertainty, and outliers.
-
Accuracy and precision are different: Accuracy measures closeness to the true value, whilst precision measures consistency between measurements. You can have precise measurements that are inaccurate, or accurate measurements that lack precision.
-
Systematic errors affect accuracy: These errors create consistent bias in one direction and cannot be fixed by repetition. Random errors affect precision and can be reduced by taking more measurements or increasing sample size.
-
Validity operates at two levels: Internal validity ensures a study investigates what it claims to investigate. External validity determines whether findings can be generalised beyond the original study sample. Without internal validity, external validity is meaningless.
-
Don't automatically dismiss outliers: Outliers require analysis and proper consideration. They may represent genuine findings or reveal important problems with the research process. Use data visualisation to identify outliers and evaluate their impact on your conclusions.