Oxygen Dissociation Curves (AQA A-Level Biology): Revision Notes
Oxygen Dissociation Curves
What are oxygen dissociation curves?
An oxygen dissociation curve shows the relationship between the percentage saturation of haemoglobin with oxygen and the partial pressure of oxygen in the surrounding environment. These curves reveal how efficiently haemoglobin can load and unload oxygen under different conditions.
When haemoglobin encounters varying oxygen concentrations, it does not bind oxygen molecules in a linear fashion. Instead, the binding pattern creates a characteristic S-shaped (sigmoid) curve that reflects the unique properties of the haemoglobin molecule.
The oxyhaemoglobin dissociation curve for adult humans:
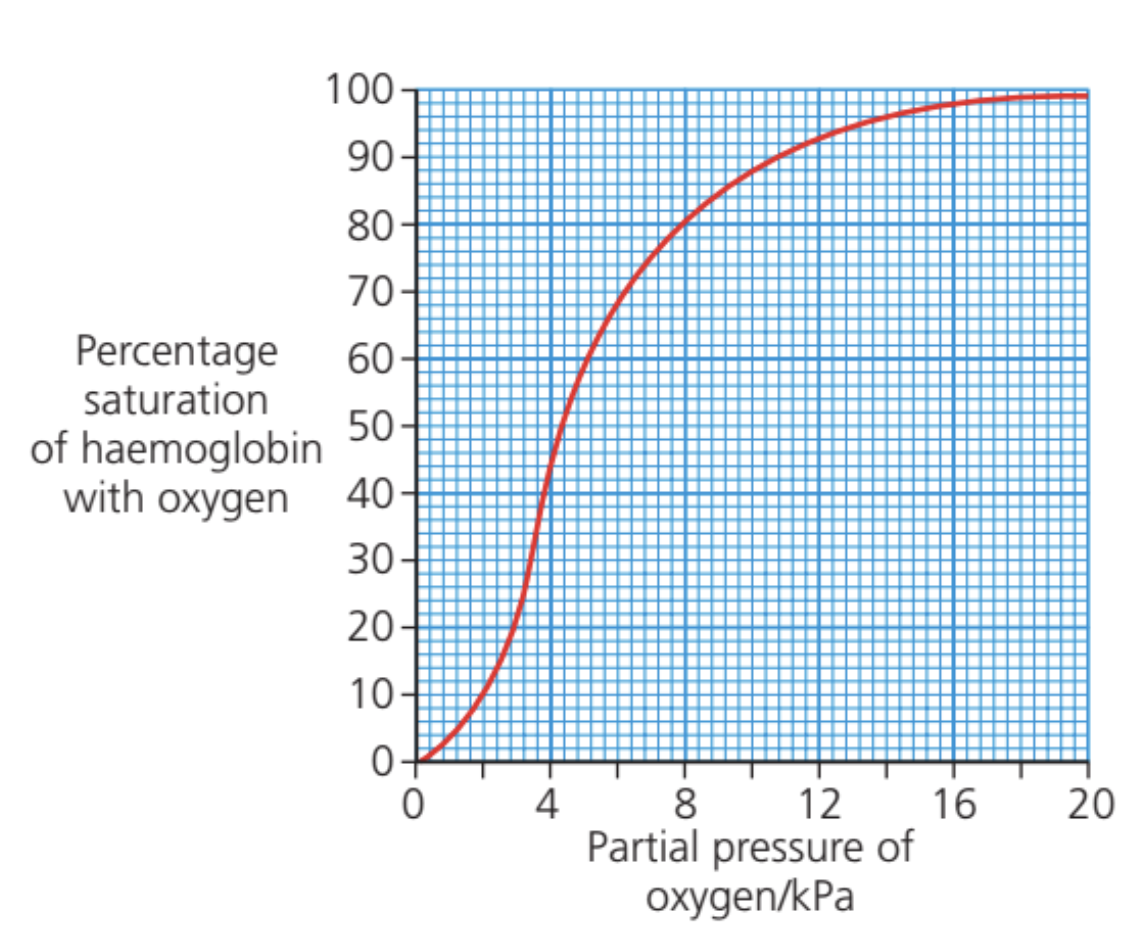
The sigmoid shape is not arbitrary - it's a direct result of haemoglobin's molecular structure and the way oxygen molecules interact with it. This curve shape is crucial for understanding how oxygen transport works in living organisms.
The mechanism behind the curve shape
The distinctive S-shape of oxygen dissociation curves results from the structural properties of haemoglobin and a process called positive cooperativity.
Initial binding difficulty
At low oxygen concentrations, the curve shows a shallow gradient initially. This occurs because the haemoglobin molecule's four polypeptide subunits are tightly packed together in their quaternary structure, making it challenging for the first oxygen molecule to find and bind to an available site.
The tight quaternary structure of haemoglobin means that the first oxygen molecule faces the greatest resistance when trying to bind. This is why the curve starts relatively flat - it's genuinely difficult for that initial binding to occur.
Positive cooperativity
Once the first oxygen molecule successfully binds, it triggers a conformational change in the haemoglobin molecule. This structural alteration makes the remaining binding sites more accessible and increases the likelihood that additional oxygen molecules will bind. This phenomenon is known as positive cooperativity - the binding of one oxygen molecule facilitates the binding of subsequent molecules.
As a result, the curve becomes steeper in the middle section, showing rapid increases in saturation as partial pressure increases.
Think of positive cooperativity like opening a tight jar lid - once you've loosened it slightly, each subsequent turn becomes easier. Similarly, once the first oxygen binds and "loosens" the haemoglobin structure, the remaining oxygen molecules can bind much more easily.
Final binding challenges
After the third oxygen molecule binds, the curve begins to level off again. Although it might seem easier to bind the fourth oxygen molecule, probability works against this. With most binding sites already occupied, there are fewer available sites for the remaining oxygen molecule to access, causing the curve gradient to reduce and eventually plateau.
Interpreting curve positions
Different haemoglobin types and environmental conditions can shift the position of oxygen dissociation curves, providing valuable information about oxygen transport efficiency.
Left-shifted curves (higher affinity)
When a curve appears further to the left, it indicates that haemoglobin has a higher affinity for oxygen. This means:
- Oxygen loads onto haemoglobin more readily at lower partial pressures
- Oxygen unloads from haemoglobin less easily
- The organism can extract oxygen efficiently from environments with lower oxygen concentrations
Left-shifted curves are advantageous for organisms living in low-oxygen environments, such as high altitudes or deep water. However, they can make it harder to release oxygen to tissues that need it.
Right-shifted curves (lower affinity)
Curves positioned further to the right show that haemoglobin has a lower affinity for oxygen. This means:
- Higher partial pressures are needed for oxygen loading
- Oxygen unloads more readily from haemoglobin
- This pattern suits organisms that need to release oxygen efficiently to tissues
Right-shifted curves are often seen in organisms with high metabolic demands or those living in warm environments where oxygen needs to be released quickly to active tissues.
Biological significance
The oxygen dissociation curve demonstrates how haemoglobin's structure perfectly suits its transport function. The cooperative binding mechanism ensures that haemoglobin can pick up oxygen efficiently in the lungs (where partial pressure is high) and release it appropriately in tissues (where partial pressure is lower).
Different species possess haemoglobin variants with distinct oxygen affinities, allowing them to thrive in their specific environments. These variations in curve position reflect evolutionary adaptations to different oxygen availability and metabolic demands.
Real-world Application: Altitude Adaptation
Mountain climbers and people living at high altitudes develop physiological changes that effectively shift their oxygen dissociation curves. Their haemoglobin becomes more efficient at capturing oxygen from the thin air, demonstrating how these curves relate to practical survival strategies.
Key Points to Remember:
- Oxygen dissociation curves show the S-shaped relationship between haemoglobin saturation and oxygen partial pressure
- Positive cooperativity explains why the curve is steep in the middle - first oxygen binding makes subsequent binding easier
- Left-shifted curves indicate higher oxygen affinity (loads easily, releases reluctantly)
- Right-shifted curves indicate lower oxygen affinity (loads reluctantly, releases easily)
- The curve shape reflects haemoglobin's quaternary structure and cooperative binding mechanism