Required Practical 9 (AQA A-Level Chemistry): Revision Notes
📚 Revision Notes
8.1.3 Required Practical 9
Aim:
Investigate how pH changes when a weak acid reacts with a strong base and when a strong acid reacts with a weak base.
pH Probe Calibration:
Method:
- Rinse the pH probe: Thoroughly rinse the pH probe with deionised (distilled) water and gently shake to remove any excess water.
- Calibrate with pH 7.00 buffer: Insert the probe into the standard pH 7.00 buffer solution provided.
- Ensure the bulb is fully immersed, then record the pH reading.
- Repeat calibration for other buffers: Rinse the probe again with deionised water before each reading.
- Repeat the procedure using pH 4.00 and pH 9.20 buffer solutions, recording the pH values for each.
- Plot the calibration graph: Create a graph by plotting your recorded pH readings (x-axis) against the known pH values of the buffer solutions (y-axis).
Measuring pH: Acid-Alkali Mixture
Method:
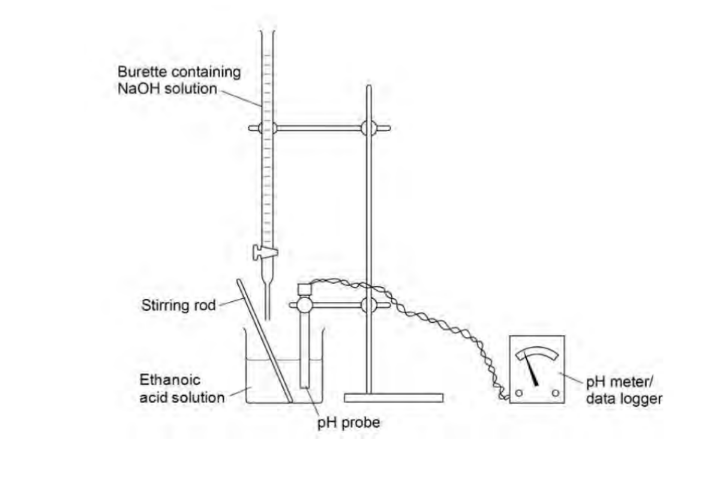
- Prepare the burette with ethanoic acid: Rinse a burette with a 0.100 mol dm⁻³ solution of ethanoic acid, then fill the burette with the same solution.
- Label the burette. Ensure the jet of the burette is completely filled without any air bubbles.
- Transfer ethanoic acid: Use the burette to transfer exactly 20.0 cm³ of ethanoic acid into a clean 100 cm³ beaker.
- Prepare the burette with sodium hydroxide ( ): Rinse a second burette with 0.100 mol dm⁻³ solution, then fill this burette with the same solution.
- Label the second burette, ensuring the jet is filled without air bubbles.
- Set up the pH probe: Rinse the pH probe with distilled (deionised) water and clamp it so that the bulb is fully immersed in the ethanoic acid solution in the beaker.
- Stir and record the initial pH: Stir the solution gently with a glass rod and record the initial pH reading in a suitable table.
- Add in increments: Add 2.0 cm³ of solution from the burette at a time, stirring the solution and recording the pH after each addition.
- Record the pH and the corresponding volume of added.
- Approach the endpoint: As the endpoint approaches, reduce the increments of added to 0.20 cm³, continue to stir the solution and record the pH and volume of added after each addition.
- Complete the titration: After reaching the endpoint, continue adding 2.0 cm³ portions of until an excess is achieved.
- Stir the solution and record the pH and volume for each addition. These results will allow a pH curve to be plotted.
Analysing the Data:
- Use the pH probe calibration graph to correct the pH readings obtained during the experiment. These corrected pH values should be recorded in a new column in the results table.
- Plot a graph of the corrected pH values (y-axis) against the volume of sodium hydroxide () solution added (x-axis).
- Connect the data points in the most appropriate way, forming a smooth curve.