Time of Flight Mass Spectrometry (AQA A-Level Chemistry): Revision Notes
1.1.3 Time of Flight Mass Spectrometry
Time of Flight (TOF) Mass Spectrometry
The Time of Flight (TOF) mass spectrometer is a technique used to identify elements and determine their relative molecular masses. It provides accurate data about relative isotopic masses and the relative abundance of isotopes. TOF mass spectrometry is particularly useful for determining isotopic composition and calculating the relative atomic mass of elements.
Stages of TOF Mass Spectrometry
1. Ionisation
There are two types of ionisation used in TOF mass spectrometry:
- Electrospray Ionisation:
- The sample is dissolved in a volatile solvent and injected through a fine needle, producing a mist.
- A high voltage is applied to the needle, causing the particles to gain a proton , forming positive ions.
- The solvent evaporates, leaving behind gaseous ions.
- Electron Impact Ionisation:
- The sample is vaporised, and high-energy electrons are fired at it using an electron gun.
- This knocks off an electron from each particle, producing +1 ions.
2. Acceleration
- The positively charged ions are accelerated by an electric field.
- All ions are given the same kinetic energy , but their velocities will differ depending on their mass.
- Lighter ions move faster than heavier ions.
3. Ion Drift
- The ions enter a flight tube where there is no electric field.
- Ions drift through the tube, with the lighter ions (which move faster) arriving at the detector before the heavier ones.
4. Detection
- When ions reach the detector, they gain an electron, producing a current.
- The size of the current is proportional to the number of ions hitting the detector, indicating the abundance of each ion.
- The time taken for ions to reach the detector is used to calculate their mass-to-charge ratio (m/z).
Mass Spectra Interpretation
The mass spectrometer generates a spectrum, which is a graph of m/z values (on the x-axis) versus relative abundance (on the y-axis).
Key Points
- Isotopes produce different peaks on the spectrum because each isotope has a different mass.
- The peak height indicates the relative abundance of each isotope.
- The base peak is the tallest and represents the most abundant ion.
- For single-charged ions ions), the m/z ratio corresponds directly to the ion's mass.
Mass Spectrum of an Element: Magnesium
Magnesium has three naturally occurring isotopes: Mg-24, Mg-25, and Mg-26. These isotopes appear as distinct peaks on the mass spectrum, each with a different m/z value.
-
m/z = 24: Represents , the most abundant isotope, shown as the base peak with the highest relative abundance.
-
m/z = 25: Corresponds to , with a smaller relative abundance.
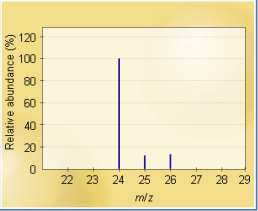
-
m/z = 26: Refers to , another isotope of magnesium with slightly more neutrons than . The relative atomic mass (Ar) of magnesium can be calculated using the weighted average of the isotopic abundances:
This value reflects the average mass of all magnesium atoms.
Mass Spectrum of a Molecular Element: Chlorine
Chlorine has two main isotopes: and . When chlorine molecules are analysed in a mass spectrometer, multiple peaks are observed due to the combinations of these isotopes:
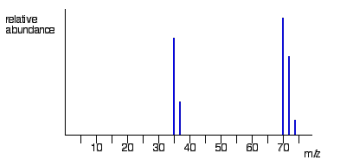
- m/z = 35:
- m/z = 37:
- m/z = 70: Represents the molecule with both atoms being .
- m/z = 72: Represents (one atom of each isotope).
- m/z = 74: Represents (both atoms being ). These peaks show how isotopes combine to form diatomic molecules, which can lead to multiple signals in the spectrum.
Mass Spectrum of a Compound: Ethanol
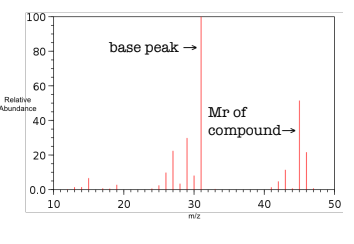
In the mass spectrum of ethanol, there are several peaks of interest:
- m/z = 46: This is the molecular ion peak, representing the molecular mass of ethanol as a whole.
- Base Peak (m/z = 31): This is the most intense peak and represents a fragment of the ethanol molecule, often corresponding to a stable ion produced during fragmentation.
- Small Peak (m/z = 47): This peak is caused by the presence of a atom in the molecule, leading to a slight increase in the mass. The presence of the molecular ion peak (m/z = 46) allows us to determine that the molecular mass of ethanol is 46. Fragmentation produces smaller peaks, which give information about the molecular structure.
Summary
- Base Peak: The tallest peak indicating the most abundant ion.
- Molecular Ion Peak: The peak that corresponds to the molecular mass of the compound.
- Isotope Peaks: Multiple peaks can indicate the presence of isotopes, especially in elements like magnesium and chlorine.