Distribution of Income and Wealth (AQA A-Level Economics): Revision Notes
Distribution of Income and Wealth
The difference between income and wealth
Understanding the distinction between income and wealth is fundamental to analysing economic inequality. Although these terms are often used interchangeably in everyday conversation, they represent different economic concepts.
Income refers to the flow of money that a person or household receives over a specific time period. This includes wages and salaries paid into a household's bank account, which represent an inward flow of money. For households with at least one working member, these regular payments form the primary source of income. For homeowners, the house they live in minus any outstanding mortgage debt typically constitutes a significant portion of their personal wealth.
Income is a flow concept - Think of it like water flowing from a tap. It measures the amount of money coming in during a specific period (hourly, weekly, monthly, or annually). Just as water flows continuously, income flows into your account on a regular basis.
Wealth, by contrast, is a stock concept representing the total value of everything a person or household owns at a particular point in time. It is the historical accumulation of assets with value. A mortgage is a long-term loan secured against the value of a house, which reduces household wealth until it is paid off.
Wealth is a stock concept - Think of it like a reservoir of water. It measures the total accumulated value of everything you own at a specific moment in time, minus what you owe. Unlike income, which flows over time, wealth is a snapshot of your financial position.
To recap, your personal income represents the flow of money you receive on an hourly, weekly, monthly or annual basis. Some of this income (the portion you save) can add to your personal wealth. This creates an important link between income and wealth. A second link operates in the opposite direction—wealthier individuals tend to earn more investment or unearned income, which increases their total income.
The Wealth-Income Cycle
This creates a virtuous circle for the wealthy: wealth generates income, which enables saving, and saving adds to wealth.
Unfortunately, many of the poor experience a vicious circle: low income forces them to borrow, borrowing creates debt, debt repayment reduces income further, consumption falls, and any accumulated wealth disappears.
The distribution of income and wealth
The distribution of income describes how personal or household income is divided among different groups in society, such as between rich and poor. The term extends beyond simple rich-poor comparisons to include distributions across various categories—between people in different regions of the economy, between different generations (young versus old), and between men and women. Income distribution can also be examined internationally, comparing countries at different stages of economic development that have varying total income levels and different internal distributions between rich and poor.
Similarly, the distribution of wealth measures how personal or household wealth is distributed among different groups in society. Again, whilst the rich-poor distribution receives most attention, economists also examine differences across regions, age groups and genders.
Understanding quintiles and quantiles
A quintile represents one-fifth of a total amount divided into equal-sized groups. When examining income distribution data, the total income is divided into five equal portions, creating income quintiles. Other commonly used divisions include:
- Quartiles: the total divided into four groups
- Deciles: the total divided into ten groups
- Vigintiles: the total divided into 20 groups
- Percentiles: the total divided into 100 groups
These divisions allow economists to analyse how income or wealth is distributed across the population in a detailed and systematic way.
Significant UK Income Inequality
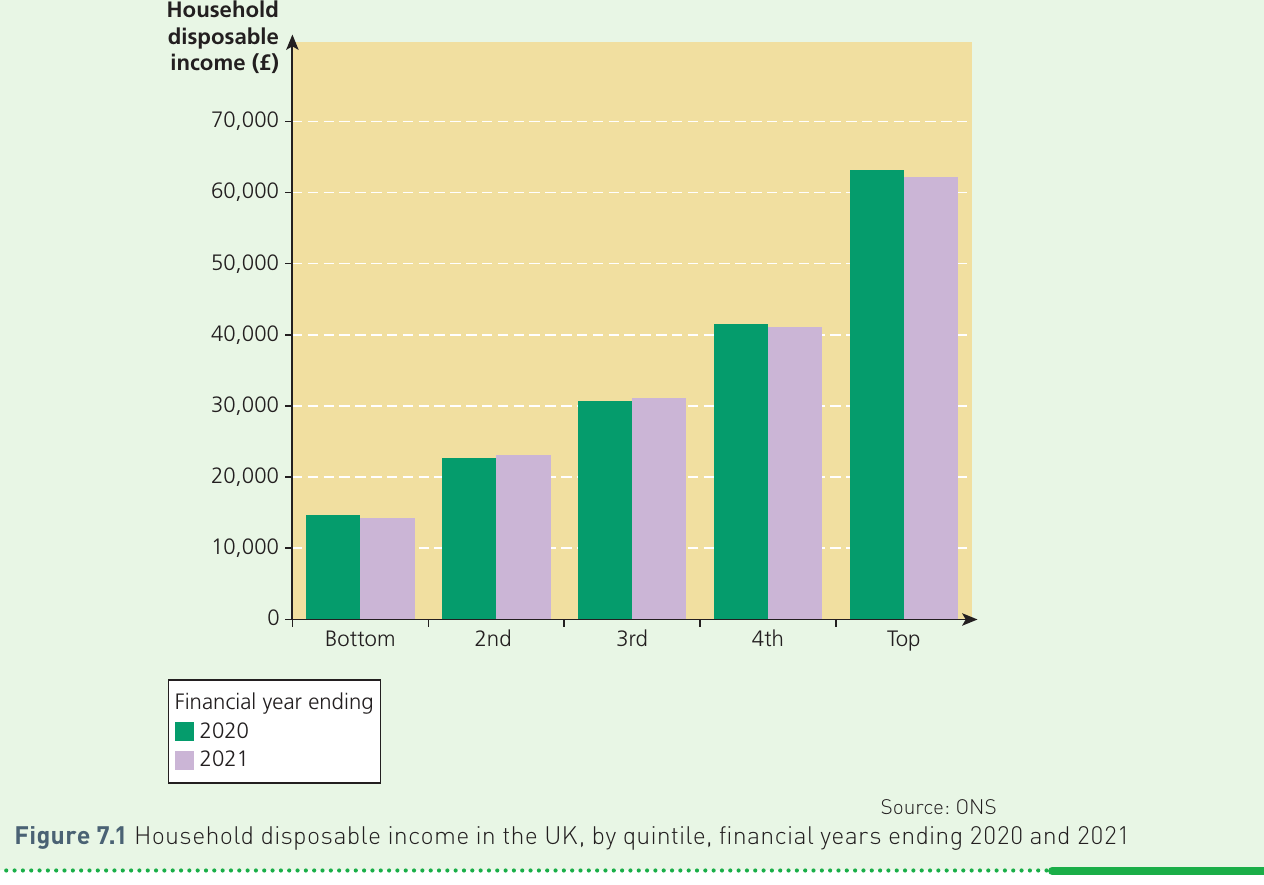
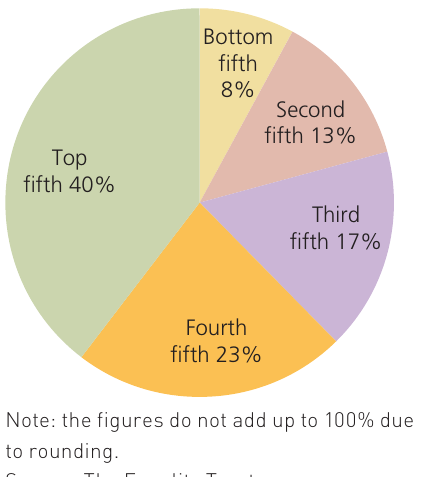
This distribution reveals significant inequality in the UK. In 2018, the top fifth of UK households received 40% of total household income, whilst the bottom fifth received only 8%. This data relates to income after taxes have been deducted and welfare benefits received.
This means the richest 20% of households earned five times as much as the poorest 20%.
International income classifications
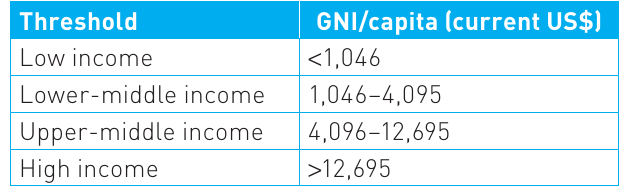
The World Bank classifies countries into four income groups based on Gross National Income (GNI) per capita, measured in current US dollars. GNI represents the total value of goods and services produced by an economy in a year, including net incomes earned by factors of production overseas. Per capita means this total is divided by the country's population size.
Worked Example: Country Income Classifications
These thresholds help classify countries' economic development status:
- High-income country: The UK with a GNI per capita of $45,380 (2021 data)
- Upper-middle income: Turkey with $9,830 (2021)
- Lower-middle income: Bolivia with $3,360 (2021)
- Low-income: Democratic Republic of Congo with $580 (2021)
Notice how the UK's GNI per capita is over 78 times higher than the Democratic Republic of Congo's, illustrating vast global income inequality.
Factors which influence the distribution of income and wealth
Income and wealth have been unequally distributed in the UK throughout history. Even during periods of economic growth and full employment, the incomes of wealthy individuals tend to increase faster than those of the poor. This means economic growth can actually widen income differences, although those with little money may still end up absolutely better off in real terms.
Factors influencing the distribution of income
Multiple interconnected factors determine how income is distributed across society. These include the rewards paid to different factors of production, the distinction between earned and unearned income, wage differentials between occupations, and the effects of globalisation.
Factors of production
A crucial determinant of income distribution is how national income is divided between the different factors of production: land, labour, capital and entrepreneurs. Owners of large landholdings—such as country estates or substantial parts of London's West End—receive significant incomes through rent. This places large landowners in the top income quintiles. The share of national income going to landowners and capital owners has grown in recent years, whilst labour's share has fallen.
The Declining Share of Labour Income
For decades in many countries, the proportion of national income paid to workers has been declining since the 1980s. According to the International Monetary Fund's World Economic Outlook (April 2017), this trend results from rapid technological progress and increasing global integration.
Globally, labour's share of worldwide incomes fell from over 66% in the early 1990s to 62% in the early 2000s.
Wages have not risen as quickly as productivity, causing labour's share of national income to decline. Meanwhile, many capital owners—including entrepreneurs—receive income through dividend payments on shares they own. Profits and entrepreneurial incomes have risen at the expense of wages and salaries, with top business executives' salaries growing much faster than other workers' wages.
The distinction between earned and unearned income
Earned income includes wages, salaries, other forms of employee compensation, and self-employment income. Unearned income derives from sources other than employment, including interest payments and investment income (such as dividends paid to shareholders).
The determinants of wages discussed in labour market theory help explain differences in earned incomes. By contrast, differences in unearned income depend primarily on inequalities in wealth distribution.
Wage and salary differentials
Within the labour market, significant differences exist between the wages and salaries of those at the top and bottom of the earnings distribution. Standard supply and demand theory can explain these differentials.
Worked Example: Wage Differentials Between Airline Pilots and Aircraft Cleaners
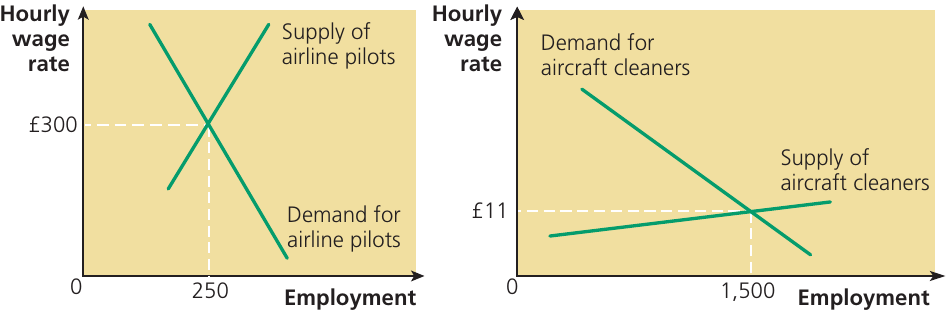
The diagram illustrates a substantial hourly wage difference between airline pilots (£300 per hour) and aircraft cleaners (£11 per hour). Two main factors explain this differential:
1. Differences in labour productivity Airline pilots possess significantly higher productivity than aircraft cleaners. The demand for pilots is less wage elastic than the demand for cleaners.
2. Different supply curve positions and slopes Long training periods and high skill requirements make the supply of airline pilots lower and more wage inelastic. Conversely, the supply of aircraft cleaners is higher at any given wage level and more wage elastic. Cleaners require minimal skills and little training. An increase in aircraft cleaner wages significantly increases the number of workers willing to take these positions.
Result: These supply and demand factors result in pilots earning £300 per hour whilst cleaners earn just £11 per hour—barely above the 2023 national living wage.
Globalisation and the international migration of workers
Globalisation and international worker migration have widened wage and salary differences between worker groups. In the UK, low-paid workers face competition from incoming migrants from poorer regions and from overseas-based workers in developing economies where UK employers have outsourced jobs.

Global Competition in Labour Markets
Call-centre workers serving the UK market but employed in India earn substantially lower wages than similar workers employed in the UK. International competition has driven down wages in UK labour markets where workers compete for jobs against similar workers in other countries.
Similar competitive pressures exist at the top end of labour markets. Well-paid UK business executives often successfully negotiate higher pay by arguing they must match the 'rate for the job' established in wealthier countries like the USA. If their pay doesn't increase, they threaten to move to better-paid positions elsewhere.
Inequality in the distribution of wealth
Whilst income distribution in the UK is unequal, wealth distribution is significantly more unequal. According to the Resolution Foundation, a UK think tank focused on improving living standards for low and middle-income families, the spread of property wealth across the UK in the mid-1990s and mid-2000s contributed to reduced wealth inequality. However, this trend has since reversed.
Extreme Wealth Inequality in the UK
The UK's total wealth of £15.2 trillion in 2020 was distributed far less equally than earnings or household income:
- One in ten adults own approximately half the nation's wealth
- The top 1% own 14% of UK wealth
- By contrast, 15% of adults have zero or negative wealth
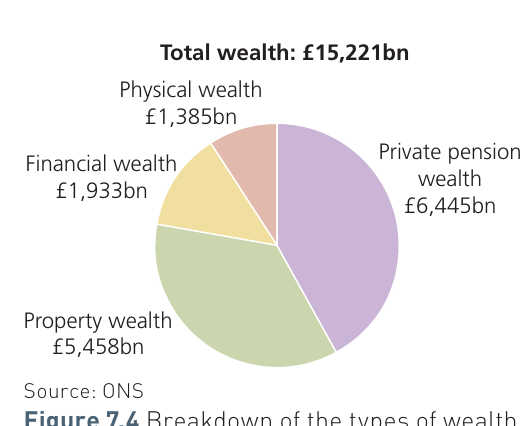
The Office for National Statistics defines total net wealth as comprising four components: net property wealth, physical wealth, net financial wealth and private pension wealth (excluding state pension rights).
Factors influencing the distribution of wealth
The factors affecting wealth distribution closely link to those influencing income distribution. High incomes enable substantial saving and spending on assets like houses, both of which increase household wealth. Conversely, households with small incomes can afford neither to save nor purchase houses, which appreciate rather than depreciate in value.
The ability to benefit from capital gains
A capital gain occurs when an asset's value increases. Most consumer durable goods—such as cars and televisions—depreciate after purchase. However, land and property values generally increase over time, at least in the UK. Share prices also tend to rise in the long run, though they can fall.
Why the Wealthy Get Wealthier Through Assets
The already wealthy typically own the most expensive houses, often multiple properties, and hold the majority of shares. The least wealthy often rent rather than own their homes and seldom own shares.
This creates another wealth accumulation advantage for those already wealthy—their assets appreciate in value, while those who rent or cannot afford assets miss out on these capital gains.
Private pension assets
Property and financial assets (primarily shares) represent marketable wealth, together accounting for 48.59% of household wealth in 2020. However, private pension assets—the total value of individuals' pensions not provided by government—constitute non-marketable wealth and comprised 42.34% of total household wealth in 2020.
Until recently, company pension schemes were unavailable to many low-paid UK workers, who also didn't contribute to private pension schemes sold by insurance companies like Standard Life. Many low-paid workers consequently expected their retirement income to come solely from the state pension, which provides little more than a poverty-level income.
Inheritance, gifts and luck
Wealthy families are often categorised as either 'new wealth' or 'old wealth'. Entrepreneurs who build large personal fortunes—often starting from scratch through founding businesses and successful risk-taking—fall into the 'new wealth' category. Members of the landed aristocracy who inherit wealth-holdings from generation to generation represent 'old wealth'.
The Transformation Between Old and New Wealth
'Old wealth' can transform into 'new wealth'—for example, when wealthy families' children use their education and inherited wealth as platforms for developing entrepreneurial skills.
Similarly, 'new wealth' can create 'old wealth' when newly rich individuals pass their fortunes to subsequent generations.
This demonstrates that wealth categories are fluid, and intergenerational wealth transfer plays a significant role in maintaining wealth inequality.
Wealth taxation versus taxation of income
In the UK, government tax revenue derives more from income taxation than wealth taxation. Wealth faces relatively light taxation, and numerous loopholes allow the wealthy to legally avoid wealth taxes such as inheritance tax. The wealthy can also afford to employ accountants and financial advisers who minimise their tax liability, enabling them to become even wealthier.
The difference between equality and equity in relation to the distribution of income and wealth
The terms equality and equity are frequently used interchangeably, which creates confusion. Whilst related, these concepts differ fundamentally.
Equality in income distribution means everyone is treated exactly the same. Complete equality requires everybody to receive identical income amounts. The degree of inequality is measured by the extent to which people's incomes differ.
Equity means everyone is treated fairly, but differently, with their individual circumstances taken into account. Few people would argue that everyone receiving identical income—regardless of effort and contribution to society—would be equitable. Arguments typically begin when people debate how much inequality is fair.
Understanding the Fundamental Difference
- Equality means treating everyone the same - it's a positive concept that can be measured objectively
- Equity means treating everyone fairly based on circumstances - it's a normative concept involving value judgements
Equity—meaning fairness or justness—cannot be measured objectively. Different people form different value judgements about what constitutes equitable or inequitable treatment. By contrast, it is possible to measure degrees of equality and inequality in income and wealth distributions.
Horizontal and vertical equity
Government intervention treating people in the same circumstances equally follows the principle of horizontal equity. This occurs when households with identical income and personal circumstances (such as number of children) pay the same income tax and qualify for identical welfare benefits.
The related concept of vertical equity justifies taking income from the rich (on grounds they don't need it) and redistributing it to the poor (because they do need it). Income distribution after taxation and transfer payments is judged by many to be more equitable than pre-tax income distribution. A transfer or transfer payment represents money for which no goods or services are received in exchange. Governments use transfer payments, such as pensions, as income redistribution mechanisms within social welfare programmes.
The Benefit Principle vs Vertical Equity
Achieving greater vertical equity can conflict with another intervention principle—the benefit principle. This argues that those who receive most government spending benefits (such as motorists benefiting from roads) should pay the most in taxes.
This creates an ongoing debate: should those who can afford to pay more taxes do so (vertical equity), or should those who use government services most pay for them (benefit principle)?
The Lorenz curve and Gini coefficient
Economists use Lorenz curves and the Gini coefficient to measure inequality. A Lorenz curve measures the extent to which income (or wealth) distribution is equal or unequal. The degree of inequality is quantified by a Gini coefficient statistic.
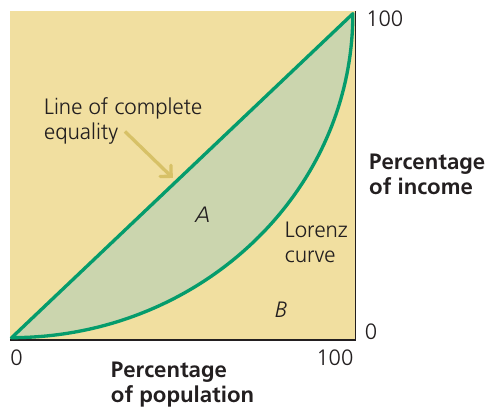
A Lorenz curve is a graph plotting the cumulative percentage of total national income or wealth against the cumulative percentage of population (ranked by increasing income or wealth share). The extent to which the curve dips below a straight 45-degree diagonal line indicates the degree of distribution inequality.
The Gini coefficient measures how much income or wealth distribution among individuals or households within an economy deviates from perfect equality.
Reading a Lorenz Curve
The Lorenz curve displays population on the horizontal axis, measured in cumulative percentages from 0% to 100%. The vertical axis shows cumulative percentage of income received by the population.
If incomes were distributed equally, the Lorenz curve would lie along the diagonal line. The closer the Lorenz curve is to the diagonal, the more equal the income distribution.
The Gini coefficient measures the area between the Lorenz curve and the diagonal as a ratio of the total area under the diagonal. Using the diagram labels, the formula is:
Interpreting the Gini Coefficient
The lower the Gini coefficient value, the more equally household income is distributed:
- Gini = 0: Perfect equality - every household has exactly the same income (Lorenz curve lies along the 45-degree line)
- Gini = 1: Perfect inequality - one person receives all income and everybody else receives nothing (Lorenz curve follows the horizontal axis, then the right-hand vertical axis)
Between these extremes:
- Lorenz curves closer to the diagonal line show greater equality (Gini coefficients approaching zero)
- Lorenz curves further from the diagonal display greater inequality (Gini coefficients approaching 1)
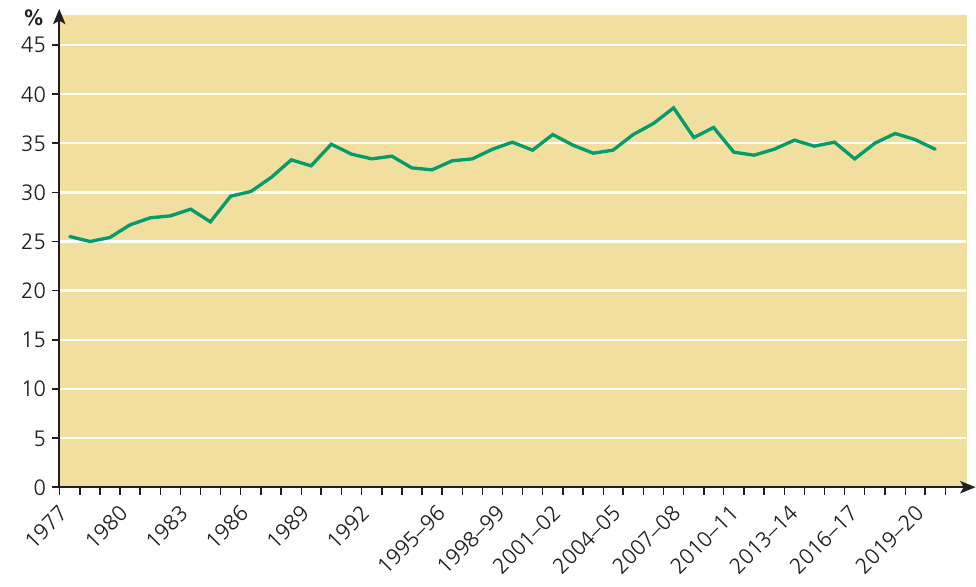
The Gini coefficient for equivalised disposable income in the UK increased during the 1980s and then fell in the early 1990s. After a slight increase around 2001, it fell again from approximately 36% to just over 34% in 2021. (Equivalised income is a measure of household income accounting for household size and composition differences, used for poverty calculations.)
The likely benefits and costs of more equal distributions of income and wealth
Some economists, particularly those favouring government market intervention, argue that more equal income and wealth distributions can promote faster economic growth. Faster growth benefits can then improve living standards and economic welfare for most or all of the population.
The Interventionist Perspective
The logic behind this argument centres on spending patterns:
- People with low incomes and little wealth typically spend all or most of their incomes on consumption, saving very little or nothing
- Increased spending on consumer goods and services raises aggregate demand in the economy, promoting economic growth
- Conversely, the better-off spend a smaller fraction of their incomes on consumption, leading to slower growth
Inequality can also mean that society's talents are wasted or underutilised. High inequality in income typically creates inequality of opportunity.
However, economists with more pro-free-market views generally reject this perspective, partly because it ignores incentives and disincentives. They argue that progressive taxation of higher incomes and wealth, combined with transferring taxed income to the less well-off through welfare benefits, significantly reduces work incentives—both among the better-off and among the poor. Reducing incentives to effort and enterprise decreases, rather than increases, economic growth rates.
The Free-Market Perspective
Extreme pro-free-market analysts argue that improving the poor's situation eventually requires first increasing rather than reducing inequality.
The argument:
- By incentivising those already working to work harder
- And encouraging unwaged welfare benefit claimants to seek employment
- Faster economic growth can be achieved
- In the long run, low-waged workers benefit even though their short-run incomes fall
This is often called the "trickle-down" theory of economic growth.
Finding the Balance
Taken to extremes, widening income and wealth inequalities undoubtedly increase poverty, at least in the short run. Most UK people subscribe to a consensus view that some redistribution is necessary—both for moral reasons and to maintain social cohesion.
The debating issues concern:
- Where to draw the line when redistributing income and wealth
- What methods should be used to achieve the desired degree of redistribution
Progressive taxation is taxation where, as income rises, a greater proportion of income is paid in tax. The term applies to specific taxes (such as income tax) or taxation generally.
Key Points to Remember
-
Income is a flow concept (money received over time), whilst wealth is a stock concept (accumulated assets at a point in time). They are linked—high income enables wealth accumulation, and wealth generates investment income.
-
Multiple factors influence income distribution, including:
- The distribution of income between factors of production (land, labour, capital, entrepreneurs)
- The distinction between earned and unearned income
- Wage differentials between occupations
- Globalisation effects on labour markets
-
Wealth distribution is more unequal than income distribution in the UK. Key factors include:
- The ability to benefit from capital gains
- Private pension assets
- Inheritance and gifts
- Differences between wealth and income taxation
-
Equality means treating everyone the same, whilst equity means treating everyone fairly based on their individual circumstances. These are different concepts—equality is measurable (positive), whilst equity involves value judgements (normative).
-
Lorenz curves and Gini coefficients measure inequality:
- The Lorenz curve shows cumulative income against cumulative population
- The closer to the diagonal line, the more equal the distribution
- The Gini coefficient ranges from 0 (perfect equality) to 1 (perfect inequality)