Government Policies Tackling Poverty (AQA A-Level Economics): Revision Notes
Government Policies Tackling Poverty
Introduction
Governments can use various policies to reduce poverty and influence the distribution of income and wealth in society. These policies work primarily through the tax and benefits system, which redistributes income from richer households to poorer ones. However, these interventions can have both intended and unintended consequences that affect work incentives, economic growth and poverty levels.
Government intervention in poverty reduction always involves trade-offs between achieving greater equality and maintaining economic efficiency. Understanding these trade-offs is crucial for evaluating anti-poverty policies.
Poverty and the tax and benefits system
How taxes and benefits redistribute income
The tax and benefits system is the main tool governments use to make the distribution of income more equal. This system takes money from those with higher incomes through taxation and transfers it to those with lower incomes through welfare benefits. Making taxation more progressive and increasing welfare benefits can reduce poverty and inequality in the distribution of income, at least in the short term.
The Long-Term Debate
There is significant debate about the long-term effects of redistributive policies. Some economists argue that reducing inequality through taxation and transfers may:
- Worsen labour market incentives
- Reduce competitiveness
- Slow economic growth
- Create welfare dependency
- Lead to long-term unemployment
According to this view, people may become dependent on welfare, remain unemployed long-term, and be reluctant to seek work. In the long run, this could mean low incomes fail to grow and poverty may actually increase. If this is true, government intervention to reduce poverty may result in government failure rather than solving the problem.
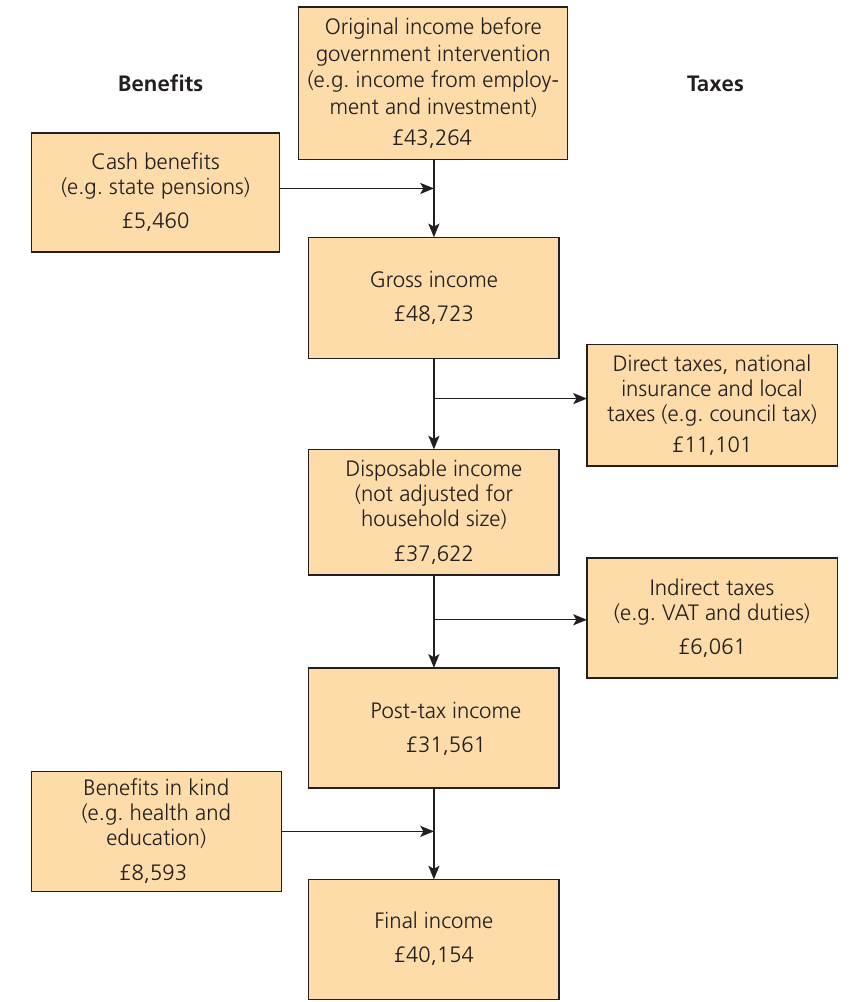
The five stages of income transformation
The tax and benefits system transforms household income through five distinct stages. Understanding these stages helps explain how government policy affects income distribution.
1. Original income
This is the starting point before any government intervention. Original income includes earnings from employment, private pensions, investment income (such as dividends from shares), and other non-government sources. This represents what households earn from market activities.
2. Gross income
Gross income equals original income plus cash benefits received from the government. Cash benefits include state pensions, unemployment benefits, and other direct payments to households. This stage shows the first government intervention to support household incomes.
3. Disposable income
Disposable income is what households have available to spend after paying direct taxes. Direct taxes include income tax, National Insurance contributions, and council tax. This is the income households can use for consumption and saving after the government has taken its share through direct taxation.
4. Post-tax income
Post-tax income accounts for the impact of indirect taxes on purchasing power. When households spend their disposable income, they pay indirect taxes such as VAT (Value Added Tax) and duties on petrol, alcohol and tobacco. Post-tax income equals disposable income minus these indirect taxes.
5. Final income
Final income is the most complete measure of household living standards. It equals post-tax income plus the value of benefits in kind provided by the government. Benefits in kind include services such as state education, healthcare through the NHS (National Health Service), and subsidised housing. These services increase household welfare even though no cash changes hands.
Worked Example: Income Redistribution in 2020/21
According to Office for National Statistics data, in 2019/20:
Original Income:
- Richest fifth: £131,670 per year
- Poorest fifth: £10,958 per year
- Ratio: 12:1
After Cash Benefits and Direct Taxes:
- Poorest fifth: increased by £5,677 to £16,635
- Richest fifth: decreased by £37,102 to £94,568
- New ratio: less than 6:1
After Indirect Taxes and Benefits in Kind:
- Final ratio: less than 4:1
This demonstrates that poorer households receive relatively larger amounts of both cash benefits and benefits in kind, while richer households pay higher amounts in both direct and indirect taxes. The tax and benefits system significantly reduces income inequality from 12:1 to less than 4:1.
Universal benefits versus means-tested benefits
Government welfare benefits can be divided into two main categories: universal benefits and means-tested benefits. Understanding the difference between these is crucial for evaluating poverty reduction policies.
Universal benefits
Universal benefits are paid to all eligible people regardless of their household income. These benefits are based on entitlement rather than financial need. Examples include:
- National insurance benefits such as state pensions
- Universal benefits for specific groups (though these have been reduced over time)
- Winter fuel payment, which provides financial assistance for heating bills
The winter fuel payment demonstrates a universal benefit. In 2022, it ranged between £100 and £300 plus additional payments to address the fuel cost crisis. The payment goes to all pensioner households regardless of income, even to wealthy pensioners who may not need it.
Advantages of universal benefits:
- Simple to administer with low bureaucratic costs
- No stigma attached to claiming them
- Everyone who qualifies receives them automatically
- Encourages take-up as there are no complex forms to complete
Disadvantages of universal benefits:
- Taxpayers' money goes to people who do not need the benefit
- Less efficient use of government resources
- May need to be paid for by cutting benefits that go to those who genuinely need help
Some economists argue that rich pensioners who currently claim universal benefits should be 'nudged' or encouraged to opt out of receiving the benefit on the grounds they do not need it.
Means-tested benefits
Means-tested benefits depend on a person's income and circumstances. With means testing, people who need a benefit must prove their eligibility, particularly if they are poor or elderly. The benefit amount may be determined by income and other financial circumstances (their 'means'). Examples include:
- Housing Benefit
- Income Support
- Universal Credit (which is replacing several means-tested benefits)
- Free school meals (income-related)
Advantages of means-tested benefits:
- More efficient as taxpayers' money is less likely to go to people who do not need it
- Better targeting of resources to those in genuine need
- Prevents waste of government spending
Disadvantages of means-tested benefits:
- Complex and expensive to administer
- May discourage take-up due to stigma or pride
- Requires form-filling and proof of eligibility
- Can create unintended disincentive effects (poverty traps)
- May prevent low-waged workers from working harder
- May discourage unemployed people from seeking employment
Recent UK Policy Changes
Between 2015 and 2022, the Conservative government rolled out Universal Credit (UC) to replace several means-tested benefits, including Housing Benefit, Income Support, and income-related Jobseeker's Allowance. Universal Credit is the main benefit paid to unemployed people.
Originally announced in 2013, the introduction of Universal Credit was hindered by expensive ICT (Information and Communications Technology) problems. It took several years before the system fully replaced the separate benefits it was designed to consolidate.
Fiscal drag, poverty and low pay
What is fiscal drag?
Fiscal drag is an important concept that helps explain how poverty can increase even without deliberate policy changes. It occurs in a progressive income tax system when the government fails to raise tax thresholds (or personal tax allowances) to keep pace with inflation.
Worked Example: How Fiscal Drag Works
Consider an example where the income tax threshold is fixed at £10,000:
Before Inflation:
- Person earns: £9,900
- Tax threshold: £10,000
- Result: Pays no income tax
After Inflation (prices and incomes double):
- Person now earns: £19,800
- Tax threshold remains: £10,000 (not raised to £20,000)
- Taxable income: £9,800
- Result: Person is now worse off in real terms because they must pay income tax they did not pay before
Even though their real income hasn't changed (it just doubled with inflation), they are now dragged into paying tax, reducing their real disposable income.
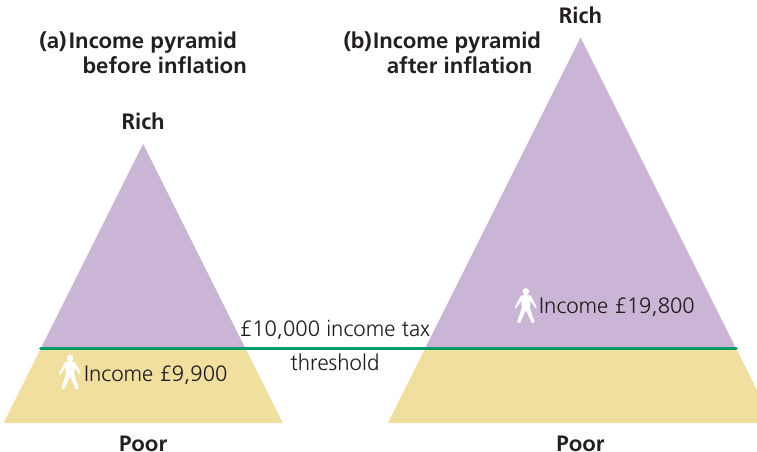
The diagram shows two income pyramids. In pyramid (a), before inflation, the person earning £9,900 is below the £10,000 threshold (shown by the green line) and pays no tax. In pyramid (b), after inflation has doubled incomes, the person now earns £19,800 but the threshold remains at £10,000. The person has been 'dragged' across the tax threshold and must now pay income tax, making them worse off in real terms.
Why Fiscal Drag Particularly Affects the Poor
Similarly, higher-paid workers who already pay income tax face a higher proportion of their income being taxed. If the higher tax rate threshold of 40% and the top rate of 45% remain unadjusted for inflation, more income is taxed at these higher rates.
This is why fiscal drag affects everyone, but particularly impacts those on lower incomes who get dragged into the tax net for the first time.
Marginal tax rates
A key concept related to fiscal drag is the marginal tax rate. This is the tax rate levied on the last pound of income received. The term can be applied to income taxes or to the taxes a person or business pays.
Understanding marginal tax rates is crucial because they determine the incentive effects of taxation. If someone faces a very high marginal tax rate, they keep only a small portion of any additional income earned, which may discourage them from working harder or seeking promotion.
Recent UK government policy
In recent years, the Conservative government attempted to reduce relative poverty among the low-paid by raising income tax thresholds faster than inflation. The basic tax threshold was raised to £12,570 in 2022. These increases in the personal tax allowance (the income level at which people start paying tax) took a significant number of low-paid workers out of the income tax net entirely. This helped 'claw back' some of the fiscal drag that had occurred in earlier years.
The earnings trap or poverty trap
Understanding the poverty trap
Fiscal drag contributes to the existence of the poverty trap. However, there are multiple ways in which poor people can become trapped in poverty. One particular mechanism, which traps the low-waged in relative poverty, is better described as the 'earnings trap'. This trap affects people in employment on low rates of pay, distinct from the unemployment trap which affects unwaged people.
The immediate cause of the earnings trap is the overlap between the income tax threshold and the means-tested benefits ceiling. This overlap is illustrated in the diagram below.
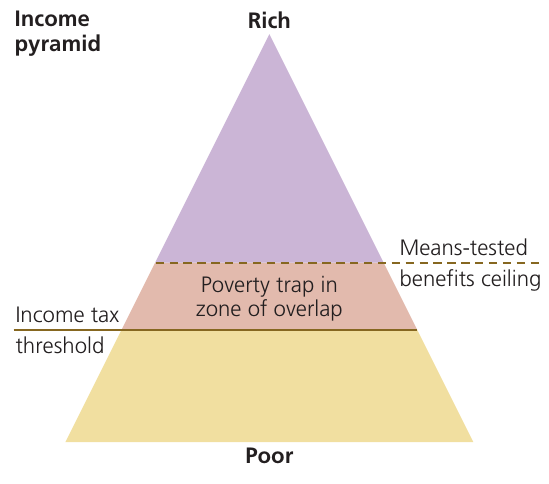
The poverty trap diagram shows an income pyramid with three layers:
- The rich at the top (purple triangle)
- A middle zone of overlap (beige section)
- The poor at the bottom (yellow trapezoid)
Two horizontal lines cross the pyramid:
- The income tax threshold (the level of income at which income tax starts to be paid)
- The means-tested benefits ceiling (the level of income at which means-tested benefits cease to be paid)
How the earnings trap works
When welfare benefits are means-tested, a person's right to claim the benefit is reduced and eventually tapers away or disappears completely as income rises. By contrast, a universal benefit is claimed as of right and does not depend on income, although the government may decide to 'claw back' universal benefits by making them taxable.
Low-paid workers caught within the zone of overlap face a particularly difficult situation. They must:
- Pay income tax and National Insurance contributions on each extra pound earned
- Lose part or all of their right to claim means-tested benefits
This creates an extremely high effective marginal tax rate. Thus, low-paid workers and their families whose income falls within this zone of overlap become trapped in relative poverty. Any increase in their pay results in little or no increase (and in extreme cases, even a fall) in their disposable income.
Effective marginal tax rates
The Severity of the Poverty Trap
The effective marginal rate of taxation for workers in poorly paid occupations becomes very high when the loss of means-tested benefits is added to deductions through income tax and National Insurance contributions. When calculated this way, the marginal tax rates of the low-paid can be much higher than the top 45% rate currently paid by the better-off on income above £150,000 (in 2022).
In practice, marginal tax rates for those in the poverty trap often reach around 70%, and in extreme cases can exceed 100%. This means that for every additional pound earned, the worker keeps only 30 pence or less.
Moreover, since the low-paid are generally employed in occupations with little job satisfaction or scope for legal tax avoidance, it can be argued that the disincentives to work imposed by the UK tax and benefits system affect the poor at the lower end of the income pyramid much more severely than they affect the better-off.
Solutions to the poverty trap
The poverty trap could be eliminated by removing the zone of overlap in the income pyramid. Several policy options exist:
1. Raise the income tax threshold
Taking low-waged households out of the income tax net entirely would help, but this is expensive for government finances.
2. Replace means-tested benefits with universal benefits
This would remove the problem of benefits being withdrawn as income rises. However, it is unlikely to happen because:
- Universal benefits are very expensive to provide
- Money must also go to people who do not need support
- Government budgets are constrained
3. Raise the National Living Wage
Raising the NLW to a higher rate might reduce poverty. However, this could be counterproductive if unemployment increases as a result. When the NLW was introduced, the Conservative government acknowledged it might lead to a loss of 60,000 jobs. A higher NLW rate could lead to even more job losses, though the government argued that continuing economic growth would create many more jobs to compensate.
4. Use behavioural economics 'nudges'
Some economists suggest using insights from behavioural economics to 'nudge' rich pensioners to opt out of claiming universal benefits they do not need. This could free up resources for means-tested benefits.
Each solution to the poverty trap has its own advantages and disadvantages. Policymakers must weigh the costs of implementation against the benefits of reducing the disincentive effects on low-paid workers. In practice, a combination of approaches may be needed rather than relying on a single solution.
Working poverty data
Data shows that poverty affects people in work as well as the unemployed. The number of workers in poverty increased from around 3 million in 2008/09 to approximately 3.8 million in 2016/17.
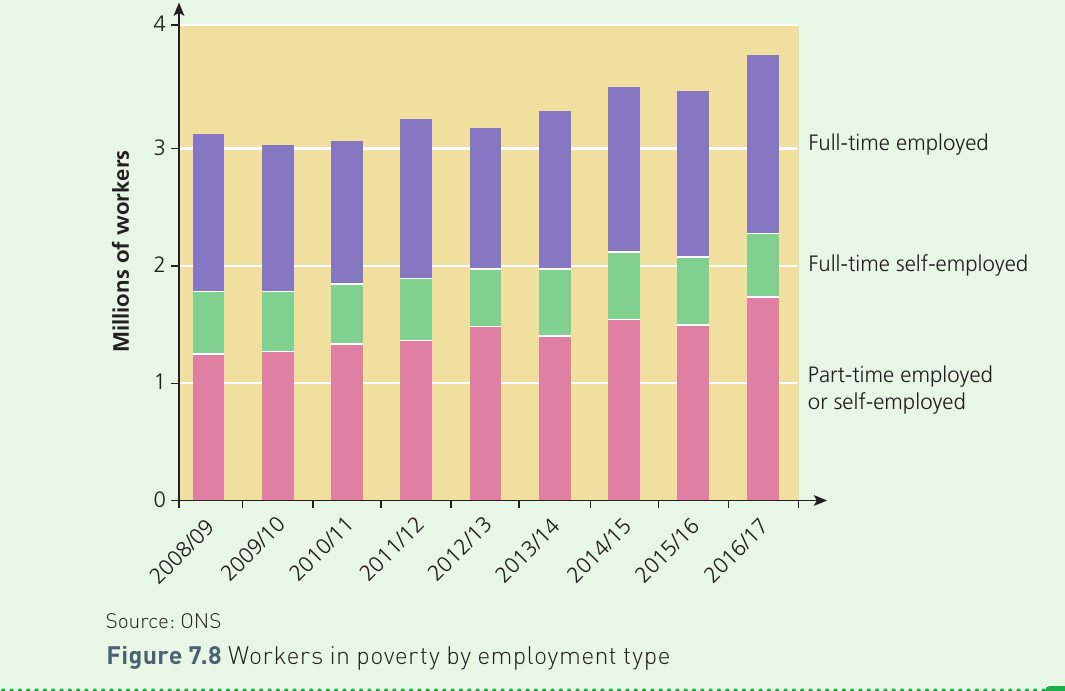
The stacked bar chart shows workers in poverty by employment type from 2008/09 to 2016/17. The data reveals:
- Full-time employed workers (purple, top section) form the largest group in poverty
- Full-time self-employed workers (green, middle section) also experience poverty
- Part-time employed or self-employed workers (pink, bottom section) make up a significant portion
This demonstrates that having a job does not guarantee escape from poverty, particularly when wages are low or employment is part-time. This is why the poverty trap (earnings trap) is such a significant policy concern.
The unemployment trap
Difference from the poverty trap
It is important not to confuse the poverty trap (or earnings trap) with the unemployment trap. While related, they affect different groups:
- Poverty trap: Affects people in employment on low rates of pay
- Unemployment trap: Affects people who are unwaged and out of work
How the unemployment trap works
The unemployment trap contains unwaged social security claimants who choose unemployment. These are people who decide they are better off out of work, living on benefits rather than working in low-paid jobs that pay income tax and National Insurance contributions. They also lose some or all of their right to claim means-tested benefits when they take work.
People caught in the unemployment trap are not officially in employment – at least in terms of officially declared work. They have chosen unemployment as their declared status.
Link to the underground economy
The Underground Economy Connection
One connection between the earnings trap and the unemployment trap is the underground economy, also called the hidden or informal economy or 'black economy'. This is an economy in which people:
- Work, usually for cash payments
- Fail to declare their income
- Sometimes fraudulently claim social security benefits
Low-paid workers in employment can escape the earnings trap by giving up declared work to claim unemployment benefits. They may then receive income from undeclared work in the underground economy. Rather than being trapped in poverty by the tax and benefits system, they exploit it to their advantage, though this involves illegal activity.
The underground economy represents a form of tax evasion and benefit fraud that costs the government significant revenue. It also creates unfair competition for businesses operating legally.
Case study: Universal Credit and the cliff edge problem
Background to Universal Credit
When Universal Credit was announced in 2013, the UK government argued that changes to the tax and benefits system would reduce penalties on almost 2 million low earners. However, a report by the Joseph Rowntree Foundation suggested that many households would struggle to deal with a more complex benefits system than before. The report stated that while 'making work pay' was the key aim of Universal Credit, many households risked being worse off in work and struggling to manage their finances.
The government claimed that in monetary terms, 3.1 million households would be entitled to more benefits as a result of Universal Credit's introduction, while 2.8 million would be entitled to less.
The free school meals cliff edge
One of the principal goals of Universal Credit was to ensure that additional earnings would always leave families better off and to avoid 'cliff edges' in incomes. However, the government's own White Paper acknowledged that Universal Credit created new cliff edges.
The Cliff Edge Problem
A significant example is the free school meals cliff edge. In 2018, the government introduced a £7,400 earnings ceiling that limited a family's right to claim free school meals for their children. This created a serious cliff edge that actually increased family poverty.
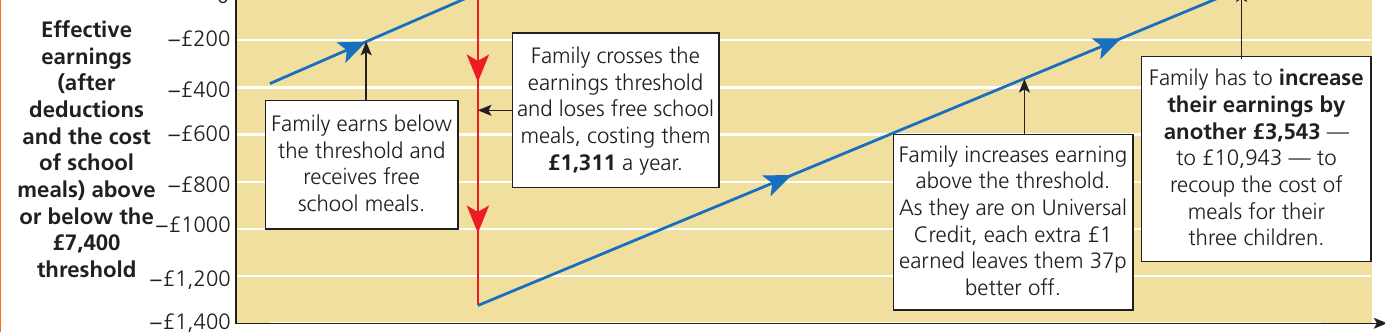
The diagram shows effective earnings after deductions and school meal costs. Key points:
- Families earning below the £7,400 threshold receive free school meals
- When a family crosses this threshold, they lose free school meals worth £1,311 annually (for three children)
- The family must increase earnings by an additional £3,543 (to £10,943 total) to recoup the cost of meals
- Due to the Universal Credit taper rate (families retain only 37p for each £1 earned above the threshold), there is a significant cliff edge
Worked Example: The School Meals Cliff Edge
Situation: A family with three children earning just below the £7,400 threshold
If earnings increase above £7,400:
- Family loses: £1,311 per year (value of free school meals for three children)
- Universal Credit taper rate: Family keeps only 37p for each £1 earned above threshold
- To recoup the £1,311 loss, family must earn an additional: £3,543
- Total earnings needed to break even: £10,943
Result: According to the Children's Society, families had to increase their earnings by another £10,943 to recoup the cost of school meals for three children. This meant that families crossing the threshold became worse off rather than better off, contradicting the stated aim of Universal Credit.
Evaluation of Universal Credit
Universal Credit demonstrates how well-intentioned government policies can have unintended consequences. While designed to:
- Simplify the benefits system
- Ensure work always pays
- Remove disincentives to employment
In practice, it has:
- Created new cliff edges that increase poverty
- Placed more families in the poverty trap
- Generated complex IT problems delaying implementation
- Left some families worse off despite working
This example illustrates the challenge of designing effective anti-poverty policies. Means-tested benefits, while more efficient than universal benefits in targeting resources, can create poverty traps and unintended disincentive effects that prevent the low-waged from escaping poverty.
Other government policies
Workplace pension schemes
Governments can use insights from behavioural economics to design policies that help reduce poverty. One example is automatic enrolment in workplace pension schemes.
The problem
Before automatic enrolment, many workers, particularly low-paid and young workers, did not join private pension schemes. This occurred for two main reasons:
-
Immediate costs outweighed future benefits: Contributing to a pension meant having less income to spend on everyday living expenses. Many low-paid workers felt they could not afford to save, preferring to "live now, pay later" rather than "save now and spend later".
-
Lethargy and inertia: Private pension schemes were often based on 'opt-in' principles. Few workers bothered to join because it required effort and initiative to sign up.
The solution: automatic enrolment
Drawing on behavioural economics insights, the UK government introduced automatic enrolment between 2012 and 2018. Under this system:
- Workers are automatically enrolled in workplace pension schemes
- Employers must contribute to the scheme
- The government adds tax relief
- Workers can opt out if they choose
This 'opt-out' rather than 'opt-in' system uses a behavioural 'nudge'. Most workers do not opt out, partly due to lethargy, but also because opting out means losing employers' contributions.
Results of Automatic Enrolment
The policy has been relatively successful:
- Few eligible workers have opted out
- Workers below age 22 must opt in (to encourage employment of young workers)
- Part-time workers are included
- Pension contributions from low-paid workers, though small, have increased significantly
However, automatic enrolment may have unintended consequences:
- It may hasten the introduction of more casual part-time and zero-hours employment contracts
- Employers might shift to more flexible contracts to reduce pension obligations
- When private pensions are added to state pensions, retirement incomes of previously low-paid workers will still be relatively low compared to more fortunate pensioners
The consequences of government policies affecting poverty
Government policies to tackle poverty and influence income distribution have various consequences, both intended and unintended:
Positive consequences
Reduced inequality: Redistributive policies through progressive taxation and welfare benefits make the distributions of income and wealth more equal. This reduces relative poverty. Many argue such policies are equitable (fair) as they help those most in need.
Alleviating specific poverty types: Redistributive policies can help alleviate:
- Child poverty
- Old-age poverty
- Fuel poverty
However, these aims have often been only partially achieved. Poverty among these groups persists despite government intervention.
Economic growth as a poverty reducer: Arguably, faster economic growth provides the main avenue for reducing absolute poverty, and perhaps also relative poverty. A growing economy creates more jobs, raises incomes, and generates tax revenue that can fund anti-poverty programs.
Negative consequences and trade-offs
Disincentive effects: Redistributive policies may have adverse unintended consequences by reducing incentives to:
- Work hard
- Be entrepreneurial
- Be competitive
The Free-Market Critique
According to pro-free-market economists, redistributive policies may lead to:
- A culture of welfare dependency
- Long-term unemployment
- Reluctance to seek work
- Slower economic growth
- Loss of international competitiveness
In this view, low incomes may fail to grow and poverty may increase in the long run. If true, government intervention in labour markets to reduce poverty results in government failure that makes problems worse.
Poverty and unemployment traps: Some fiscal measures used to reduce poverty and narrow inequalities in income distribution have resulted in the development of poverty traps and unemployment traps. These traps can:
- Discourage people from working harder
- Discourage people from seeking employment
- Keep people trapped in poverty
- Reduce overall economic efficiency
The need for balance: Policymakers must balance the goal of reducing poverty and inequality against the potential costs of:
- Reduced work incentives
- Slower economic growth
- Lower competitiveness
- Government failure
Different economic perspectives
Two Views on Redistribution
Pro-free-market economists focus on the disincentive effects of progressive taxation and transfers. They argue that wide inequalities in income and wealth may be necessary for fast economic growth to be achieved and sustained.
Interventionist economists argue that policies to reduce post-tax income inequalities and poverty are necessary and beneficial. They believe the positive effects of redistribution outweigh any negative disincentive effects.
The debate between these perspectives continues to shape government policy on poverty and inequality.
Key Points to Remember
-
The tax and benefits system transforms income through five stages: original income → gross income (+ cash benefits) → disposable income (− direct taxes) → post-tax income (− indirect taxes) → final income (+ benefits in kind).
-
Fiscal drag occurs when tax thresholds fail to keep pace with inflation, causing people to be 'dragged' into paying tax or into higher tax brackets, reducing their real income even though their circumstances haven't changed.
-
The poverty trap (earnings trap) traps low-paid workers in poverty through the overlap between the income tax threshold and means-tested benefits ceiling, creating very high effective marginal tax rates (often 70% or more).
-
Universal Credit was designed to make work pay but created new cliff edges (such as the free school meals threshold) that can actually increase poverty for some families, demonstrating how policies can have unintended consequences.
-
Government redistribution policies face a trade-off: they can reduce inequality and poverty in the short term but may create disincentive effects that reduce economic growth and worsen poverty in the long term, according to some economists.