Oligopoly (AQA A-Level Economics): Revision Notes
Oligopoly
What is oligopoly?
Oligopoly is a market structure where a small number of firms dominate an industry. The term comes from the Greek word 'oligos', meaning 'few'. This market structure sits between monopoly (one firm) and perfect competition (many firms).
Defining exactly what constitutes 'few' firms can be challenging. Should a market with 10 firms be considered an oligopoly, but one with 11 firms not? What about markets with seven very large firms alongside hundreds of smaller ones? These questions highlight that oligopoly is better understood by looking at market concentration rather than simply counting firms.
Remember that oligopoly is defined not just by the number of firms, but by their market power and behaviour towards each other.
Identifying oligopoly using concentration ratios
Understanding concentration ratios
A concentration ratio measures the combined market share held by the largest firms in an industry. For instance, a five-firm concentration ratio adds up the market shares of the five biggest companies, showing what percentage of total market output or sales they control.
Concentration ratios provide a useful indicator of oligopolistic market structures. When a small number of firms control a large proportion of the market, this suggests oligopoly conditions exist.
Concentration ratios are practical tools for competition regulators and economists to assess market power and identify potentially anti-competitive market structures.
Calculating concentration ratios: worked example
Let's examine the web browser market in Europe to understand how concentration ratios work:
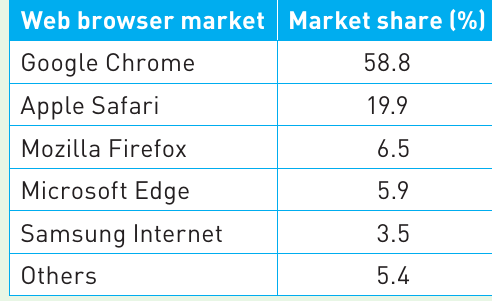
Worked Example: Four-Firm Concentration Ratio
To calculate the four-firm concentration ratio for the European web browser market:
Step 1: Identify the four largest firms by market share
- Chrome: 58.8%
- Safari: 19.9%
- Firefox: 6.5%
- Edge: 5.9%
Step 2: Add their market shares together
Calculation: 58.8% + 19.9% + 6.5% + 5.9% = 91.1%
Interpretation: This high concentration ratio of 91.1% indicates that the European web browser market operates as an oligopoly. The four largest firms control over 90% of the market, demonstrating significant market concentration.
In the absence of evidence from competition regulators (such as the Competition and Markets Authority in the UK), this would likely be classified as a competitive oligopoly rather than a collusive oligopoly.
Case study: UK banking industry
The UK banking sector provides another clear example of oligopolistic market structure:
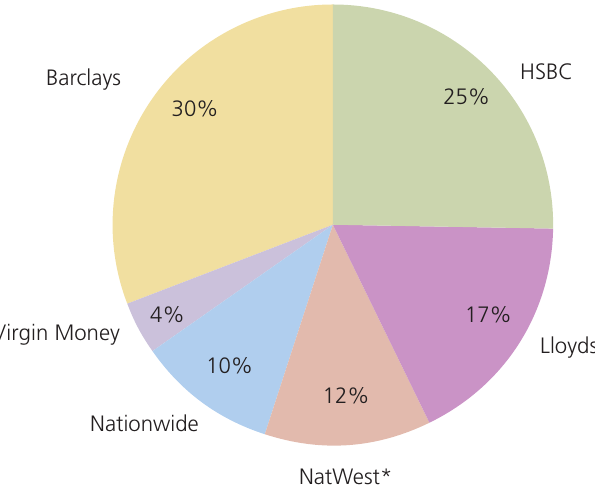
The five-firm concentration ratio for UK banks in 2021 was 94%. This means that Barclays, HSBC, Lloyds, NatWest, and Nationwide together controlled 94% of the market. While many smaller banks exist (such as Metro Bank and the Co-operative Bank), the market is dominated by these few large institutions.
Many smaller banks are not included in this data, highlighting how concentration ratios focus on the dominance of the largest firms rather than the total number of firms in the market.
Market conduct in oligopoly
Market conduct refers to the pricing and output decisions that firms make, along with their marketing strategies. This concept is also known as market behaviour, but it's important not to confuse this with market performance, which refers to the outcomes of these policies.
In oligopolistic markets, the conduct of one firm significantly affects its competitors. If a firm reduces prices to increase market share and boost profits, whether this strategy succeeds depends largely on how rival firms respond. Will they match the price cut, ignore it, or react in some other way? This interdependence is a defining feature of oligopoly.
Interdependence and uncertainty
Competitive oligopoly exists when firms are interdependent in their decision-making. This means firms must consider how competitors will react when setting prices, planning marketing campaigns, or deciding output levels. However, firms remain independent in the sense that they don't cooperate or collude with each other.
Uncertainty is a key characteristic of competitive oligopoly. A firm can never be completely certain how rivals will respond to its actions. If one firm raises prices, will competitors follow suit or hold their prices steady to capture market share? This uncertainty influences all strategic decisions.
Always explain that oligopolistic firms are interdependent (must consider rivals' reactions) but independent (make decisions separately without cooperation). This distinction is crucial for understanding competitive oligopoly.
Types of oligopoly behaviour
Non-collusive oligopoly
In non-collusive (or competitive) oligopoly, firms operate independently without forming agreements. They compete with each other on price, quality, service, and innovation. Each firm makes its own decisions while trying to anticipate how competitors will respond.
This form of oligopoly is characterized by strategic thinking where each firm considers potential reactions before taking action, creating a dynamic and often unpredictable market environment.
Collusive oligopoly and cartels
The uncertainty facing competitive oligopolists can be reduced or eliminated if firms collude. A cartel is a formal collusive agreement between firms, usually to fix prices at a high level. Cartels may also include agreements to restrict output and prevent new firms entering the market.
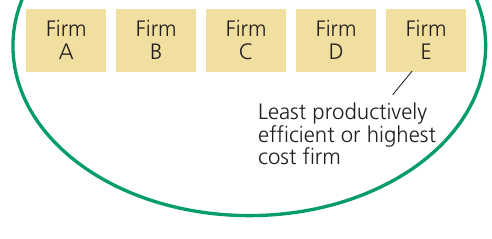
In the diagram above, five firms (A through E) form a cartel. By agreeing to fix prices and limit competition, they act like a single monopolist. However, Firm E is identified as the least productively efficient or highest-cost firm in the cartel. This becomes important when we consider incentives to cheat.
Joint-profit maximisation
When oligopolistic firms form a cartel, they can act together as if they were a single monopoly, pursuing joint-profit maximisation. This approach can generate higher profits than competitive behaviour.
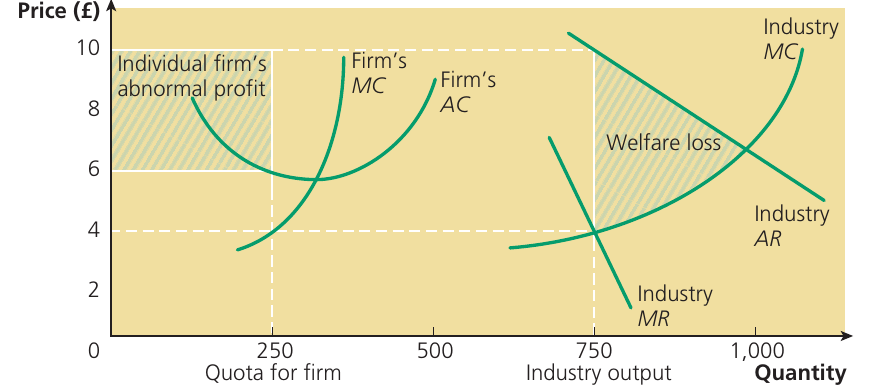
The diagram illustrates how a cartel maximises collective profit:
- The industry output is determined where the combined marginal cost (MC) curve intersects the marginal revenue (MR) curve
- The cartel sets a high price ($10) and restricts total output to 750 units
- This creates abnormal profit for member firms (shown by the shaded yellow area)
- However, it also creates welfare loss (the triangle showing lost consumer and producer surplus)
- Each firm receives a quota - in this example, 250 units per firm if the 750 units are split equally among three firms
The welfare loss created by cartels represents the economic harm to society. Consumer surplus is transferred to producers as profit, and some potential transactions that would benefit both buyers and sellers never occur due to the restricted output.
The incentive to cheat
While cartels aim to maximise joint profits, individual firms face strong incentives to cheat on the agreement. Here's why:
If the marginal cost of producing one more unit is only $4, but the cartel has set the price at $10, a firm could secretly sell additional units beyond its quota. The marginal revenue from selling that extra unit (close to $10) far exceeds the marginal cost ($4), creating substantial profit for the cheating firm.
This creates a tension between collective interests and individual interests. The cartel as a whole benefits from keeping total output low and prices high. But each individual firm can benefit even more by cheating - as long as the others don't also cheat.
Be prepared to explain this divergence between collective interest (maintaining the cartel) and individual interest (producing more to earn higher profits). This fundamental tension explains why many cartels are unstable and eventually break down.
Collusion versus market cooperation
Cartel agreements are usually illegal because they harm consumers through high prices and restricted choice, acting against the public interest. However, some forms of cooperation between firms are acceptable and may even benefit society.
Legal cooperation includes:
- Joint product development (such as the Ford Fiesta and Mazda 2 cars sharing components)
- Cooperation to improve health and safety standards
- Maintaining quality standards across an industry
Illegal collusion includes:
- Price fixing (overt collusion where firms secretly agree on prices)
- Tacit collusion (where firms reach an 'understanding' about prices without explicit agreement)
- Market-rigging agreements
Some forms of collusion are justifiable when they serve the public interest, such as joint development of products or ensuring industry safety standards. The key distinction is whether the cooperation benefits consumers and society or primarily serves to increase producer profits at consumers' expense.
Price behaviour in oligopoly
The kinked demand curve model
The kinked demand curve theory provides one explanation for price rigidity (stable prices) in oligopolistic markets. This model was originally developed to explain why prices in oligopoly often remain stable, with no price wars occurring.
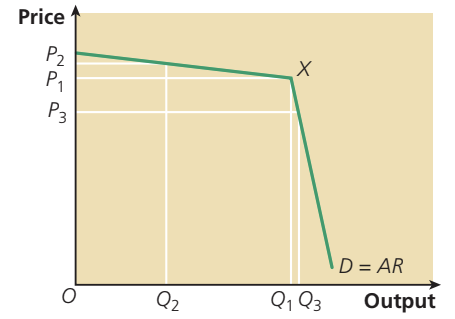
The theory works as follows:
An oligopolist initially produces output and sells at price . To understand how sales might change if price changes, firms need to know the position and shape of their demand curve. However, in imperfectly competitive markets, firms lack complete information about demand curves, especially at output levels significantly different from current production.
The demand curve shown is not necessarily the actual demand curve for the firm's output. Instead, it represents the firm's estimate of how demand will change when it adjusts its price.
Reactions to price increases
When the oligopolist increases price from to , it expects rivals to react by keeping their prices stable rather than following suit. Competitors try to gain profit and market share at the firm's expense. This means the oligopolist expects demand to be relatively elastic in response to a price increase - the rise in price from to results in a more than proportionate fall in demand from to .
Reactions to price decreases
When the oligopolist cuts its price from to , it expects rivals to react very differently. Competitors will likely match the price cut immediately to avoid losing market share. Because all firms reduce their prices together, each firm sees only a small increase in demand from new customers entering the market. The oligopolist expects demand to be less elastic, perhaps even inelastic, in response to a price cut - the fall in price from to may result in only a small increase in demand from to .
The oligopolist therefore expects rivals to react asymmetrically: not matching price increases but matching price decreases. This asymmetric response creates the distinctive kink in the demand curve.
At the initial price and output of and , the two demand curves of different elasticity meet at point X - the kink in the demand curve. This kink reflects different assumptions about how rivals will react to price changes. The oligopolist fears that both price increases and price cuts will reduce total revenue, so the safest strategy may be to keep prices unchanged.
Developing the theory further
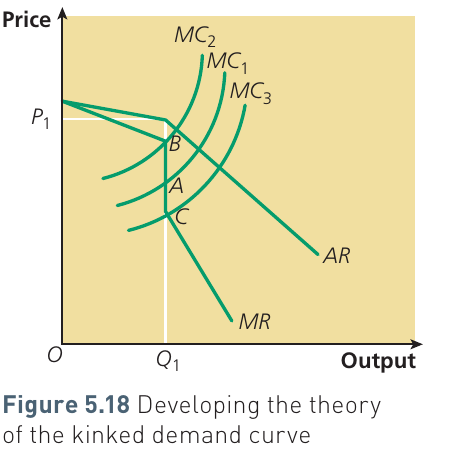
This diagram shows how the kinked demand curve theory can explain price stability even when costs change:
A discontinuity exists along the vertical line drawn above output in both the demand and marginal revenue curves. The marginal revenue curve has a vertical gap (shown by the distance from B to C) at the kink point.
Initially, the firm's marginal cost curve is , intersecting the MR curve at point A in the middle of the vertical section. The profit-maximising output remains at with price .
The key insight is that the marginal cost curve can rise to or fall to without changing the profit-maximising output () or price (). The firm's optimal price remains stable at as long as the MC curve stays between points B and C, despite considerable changes in costs.
The kinked demand curve provides a neat theoretical explanation of price rigidity, but remember its limitations (discussed below). Use it to illustrate oligopolistic interdependence and uncertainty, not as a complete theory of oligopoly pricing.
Criticisms of the kinked demand curve theory
While the kinked demand curve appears to offer an elegant explanation for price stability in oligopoly, it has several significant weaknesses that limit its usefulness as a comprehensive theory.
Major limitations:
-
Incomplete theory: It doesn't explain how firms initially arrive at point X (the kink). Why does the firm start at this particular price and output combination?
-
Lack of empirical support: Real-world pricing evidence provides little support for the theory. Competitive oligopolies rarely respond to price changes in the manner assumed by the model.
-
Unrealistic assumptions: It's more reasonable to expect firms to test the market - raising or lowering prices to see how rivals react. If competitors don't respond as expected, firms would revise their understanding of the demand curve rather than assuming it's kinked.
-
Price changes do occur: Research shows that oligopoly prices tend to be stable or 'sticky', but firms do raise and lower prices quickly and by significant amounts when production costs change substantially or when unexpected demand shifts occur.
The kinked demand curve model is useful for illustrating how oligopolists are interdependent and affected by uncertainty. However, it's not a complete or accurate theory of oligopoly pricing. Many economists no longer accept it as the primary explanation for price behaviour in oligopoly.
Price leadership
Because overt collusive agreements like cartels are usually illegal, competitive firms in oligopoly often use less formal methods to coordinate pricing decisions. Price leadership occurs when one firm (usually the dominant or largest firm) sets prices, and other firms in the industry follow that pricing example.
This form of tacit coordination allows firms to avoid the uncertainty of competitive pricing without explicitly colluding. The price leader effectively signals to the market what the appropriate price level should be, and other firms align their prices accordingly.
Price agreements
Price agreements can occur between firms and their suppliers, or between firms and their customers. These agreements specify the pricing of goods or services for a set period, such as six months.
Unlike cartel agreements that fix prices for final consumers, price agreements between firms at different stages of production may be legal in some circumstances, particularly when they provide stability for business planning.
Price wars
Price wars occur when rival firms continuously lower prices to undercut each other. These can happen in both monopolistic competition and oligopoly markets. A price war might start accidentally or may be instigated deliberately to damage competitors.
Price leadership usually involves relatively friendly relations between competing companies, with price wars representing the opposite - aggressive competition centred on price cutting to increase market share.
Price wars can have mixed effects:
- Short-term benefits for consumers: Lower prices provide immediate savings
- Long-term concerns: If firms are driven out of business, the surviving firms gain greater monopoly power and may subsequently raise prices significantly, harming consumers
Advantages and disadvantages of oligopoly
The term 'oligopoly' encompasses a range of market structures - from pure duopoly (just two firms) to markets with many firms where a few dominant firms coexist with numerous smaller competitors. It also ranges from competitive non-collusive oligopoly to cartels. Therefore, not all advantages and disadvantages apply to every oligopolistic market.
Possible advantages of oligopoly
Economies of scale: Like monopolies, oligopolistic firms can benefit from economies of scale, allowing them to become more dynamically efficient. These cost savings can be passed on to consumers as lower prices.
Easier consumer choice: With only a few firms to choose from, consumers find it easier to compare options and select the best product for their needs. Other markets with too many choices can lead to confusion. Behavioural economists have noted that an overwhelming number of options can actually reduce consumer welfare.
Innovation and product development: Provided some degree of competition exists, oligopolists continuously innovate and develop new and improved products to gain competitive advantage over rivals.
Possible disadvantages of oligopoly
Higher prices and restricted output: Like monopolies, oligopolies restrict output and raise prices (generating abnormal profits) compared to more competitive markets. Firms may become complacent and content with comfortable profits rather than striving for efficiency.
Cartels combine the worst features: Cartels represent a particularly harmful form of market structure. They combine the disadvantages of monopoly (high prices, productive and allocative inefficiency, restricted choice) with few if any offsetting benefits.
Barriers to entry: Small, competitive, and innovative firms may find it very difficult to enter oligopolistic markets. High barriers to entry protect existing firms from competition.
Producer sovereignty: As in monopoly, the producer rather than the consumer becomes dominant in oligopoly markets. Producer sovereignty replaces consumer sovereignty, with firms determining what products are available rather than responding primarily to consumer preferences.
Real-world application: UK supermarket competition
The UK supermarket industry provides an excellent example of oligopolistic competition and strategic behaviour.
Case Study: Tesco vs. Discount Retailers
Background: Tesco historically dominated the UK supermarket sector but faced increasing competition from discount retailers Aldi and Lidl. Management expert Alastair Dryburgh (writing in 2014) argued that Tesco couldn't compete on price with firms that had systematically designed their businesses to operate at lower costs - similar to how British Airways couldn't compete with Ryanair on price.
Strategic challenges:
- Some commentators suggested Tesco should cut prices significantly, but Dryburgh believed this would be damaging
- Aldi publicly stated its intention to undercut Tesco by at least 15%
- Aldi stocked only around 1,500 product lines compared to Tesco's 90,000
- Around 90% of Aldi's products were own-brand
- Package sizes were optimised for shelf-ready delivery
Forms of non-price competition:
Tesco responded by investing in convenience stores in high-street locations and suburban shopping parades, rather than competing directly on price with discount retailers. This represents product differentiation and market segmentation - targeting different customer needs (convenience vs. low prices).
Use real-world examples like supermarket competition to illustrate oligopolistic behaviour, particularly the importance of non-price competition when firms can't match competitors' cost structures.
Remember!
Key Points to Remember:
-
Oligopoly is a market structure dominated by a few large firms. It's identified using concentration ratios that measure the combined market share of the biggest firms.
-
Interdependence and uncertainty are key features. Firms must consider how rivals will react to their decisions, but they can never be certain of these reactions.
-
Oligopolies can be competitive or collusive. Non-collusive oligopolies involve independent decision-making, while collusive oligopolies form cartels to fix prices and restrict output.
-
The kinked demand curve explains price rigidity by showing how oligopolists expect rivals to react asymmetrically to price changes. However, this theory has significant limitations and lacks strong empirical support.
-
Oligopoly has both advantages and disadvantages. Benefits include economies of scale and innovation, while drawbacks include higher prices, restricted output, and barriers to entry - especially in cartels.