Interrelationship Between Markets (AQA A-Level Economics): Revision Notes
Interrelationship Between Markets
Introduction to market connections
Markets in an economy do not operate in isolation. Changes in one market can trigger effects in other related markets through various connections. Understanding these relationships helps explain how the price mechanism coordinates economic activity across different sectors.
When demand or supply curves shift in one market, this can cause shifts in other markets. These shifts may occur on either the supply side or the demand side, depending on how the goods or services are related. The main types of relationships between markets include joint supply, competitive demand, composite demand, and derived demand.
Markets are interconnected systems where changes in one market ripple through to affect related markets. The price mechanism acts as the coordinating force that transmits these effects across different sectors of the economy.
Joint supply
Joint supply occurs when producing one good automatically results in the creation of another product from the same production process. The second product is often called a by-product.
How joint supply works
Consider the relationship between beef and leather production. When farmers slaughter cattle to meet increased demand for beef, they simultaneously produce more cow hides. These hides become leather, so the supply of leather increases even though there has been no change in demand for leather itself.
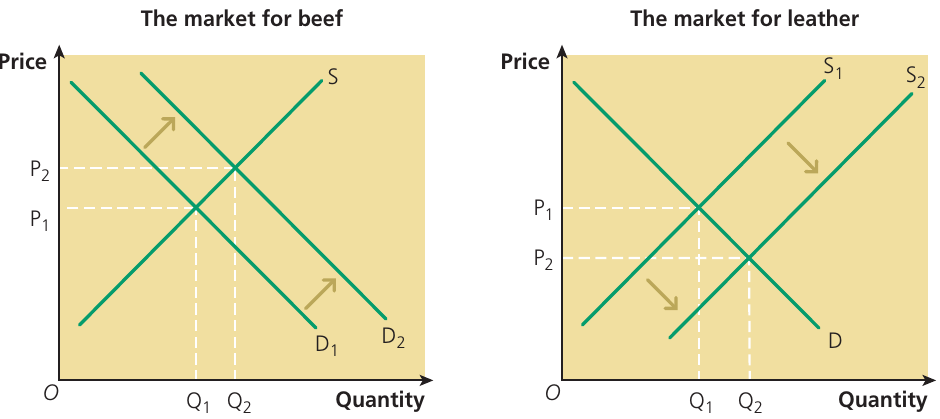
In the diagram above, the beef market (left) shows a rightward shift in demand from D₁ to D₂. This increases both the price and quantity of beef sold. Because beef and leather are in joint supply, producing more beef means producing more leather. This shifts the supply curve for leather rightward from S₁ to S₂. The result is that leather prices fall from P₁ to P₂, even though demand for leather has not changed.
Key mechanism in joint supply:
When demand for the main product increases, the price of the by-product typically falls because its supply has increased. This is the opposite of what many students initially expect - more production leads to lower prices for the by-product, not higher prices.
Examples of joint supply
- Beef production and leather supply
- Oil refining produces both petrol and diesel
- Sheep farming produces both wool and mutton
- Processing sugar cane produces both sugar and molasses
Joint demand and competitive demand
Joint demand
Joint demand describes the situation where two goods are used together as complements. When demand for one increases, demand for the other also rises. For example, if more people buy games consoles, demand for video games will increase.
Competitive demand
Competitive demand happens when consumers view two goods as alternatives or substitutes for each other. When the price of one good rises, consumers switch to the substitute, increasing demand for it.
Worked Example: Gaming Console Competition
Consider gaming consoles. Sony PlayStation and Microsoft Xbox compete for the same customers. If Sony raises the price of its consoles significantly, some consumers will switch to buying Xbox consoles instead. This means:
- Demand for Xbox consoles increases
- Demand for PlayStation consoles decreases
- The two products are in competitive demand because they satisfy the same consumer need
This demonstrates how competitive demand creates an inverse relationship between the price of one good and the demand for its substitute.
Exam tip: When analysing competitive demand, think about the cross elasticity of demand. A positive cross elasticity value indicates that two goods are substitutes in competitive demand.
Composite demand
Composite demand refers to situations where a single good has multiple different uses. An increase in demand for one use of the good reduces the quantity available for alternative uses, which can drive up prices across all uses.
The biofuels and food example
Agricultural crops like wheat, maize, and sugar cane face composite demand. These crops can be used either for human food consumption or for producing biofuels (energy). When demand for biofuels increases, farmers divert more of their crop production toward biofuel production. This leaves less available for food, causing food prices to rise.
In recent years, concerns about climate change and energy security have driven increased biofuel production. Much of the US maize crop, for instance, goes into making ethanol fuel. This competing use has contributed to higher food prices globally, raising concerns about food affordability, particularly in developing countries.
The trade-off in composite demand:
Composite demand creates a fundamental trade-off. Using agricultural land and crops for fuel production means less is available for feeding people. Policymakers must balance environmental goals against food security. This illustrates how markets with composite demand face competing priorities that can have significant social and economic consequences.
Derived demand
Derived demand occurs when demand for one good exists not for its own sake, but because it is needed to produce something else. The demand is "derived" from demand for the final product.
How derived demand works
Capital goods such as machinery, raw materials, and component parts all face derived demand. If consumer demand for cars increases, this creates derived demand for:
- Steel and aluminium (raw materials)
- Car engines and gearboxes (components)
- Factory machinery and robots (capital equipment)
- Labour in car manufacturing plants
Conversely, if demand for cars falls, demand for all these inputs also decreases. The fortunes of suppliers are tied to demand in the final goods market.
Worked Example: Derived Demand During Recessions
During economic recessions, when consumer spending falls, demand for consumer durables like cars and appliances drops sharply.
The chain reaction:
- Consumers reduce spending on big-ticket items like cars
- Car manufacturers cut production
- Demand for steel, aluminium, and plastic components falls
- Demand for manufacturing equipment decreases
- Demand for labour in car plants declines
This immediately reduces derived demand for the materials and components needed to make these products, affecting industries throughout the supply chain. This demonstrates how derived demand can amplify economic downturns across multiple interconnected markets.
Real-world application: the digital music revolution
The music industry provides a clear example of competitive demand between substitute goods. Physical formats (vinyl records, CDs, and DVDs) have largely been replaced by digital downloads and streaming services.
When streaming services like Spotify and Apple Music emerged, they offered a more convenient and affordable way to access music. Consumers increasingly viewed streaming as a substitute for buying physical CDs or downloading files. As demand for streaming increased, demand for CDs fell dramatically. Many physical music shops closed as customers switched to online platforms.
Interestingly, vinyl records have experienced a recent revival, suggesting that some consumers view them as distinct from other formats rather than perfect substitutes. This shows that competitive demand relationships can change over time as consumer preferences evolve.
Agricultural market instability
Agricultural markets demonstrate particularly interesting examples of market interrelationships. They also exhibit two specific problems: long-run price decline and short-run price volatility.
Long-run trends in agricultural prices
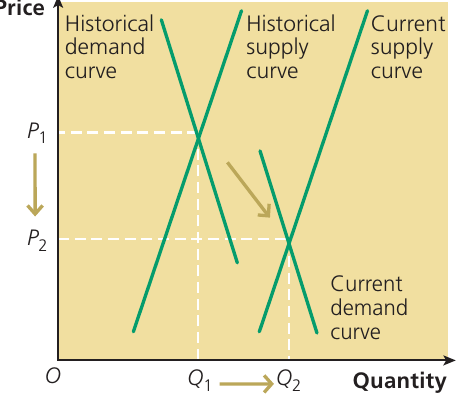
Historically, agricultural prices have tended to fall relative to prices of manufactured goods. The diagram shows how both demand and supply curves have shifted rightward over time, but the supply shift has exceeded the demand shift. This results in higher equilibrium quantities but lower equilibrium prices (from P₁ to P₂).
Several factors explain this pattern:
- Population growth increases demand for food
- Rising incomes increase demand, though food has relatively low income elasticity
- Improved farming methods (mechanisation, fertilisers, pesticides, better seeds) greatly increase supply
- Productivity improvements in agriculture have outpaced demand growth
Since the global financial crisis of 2008-09, there are signs this long-run trend may be reversing, with food prices beginning to rise relative to manufactured goods. Factors include growing middle-class populations in developing countries (increasing demand) and climate change impacts on agricultural productivity.
Short-run price volatility
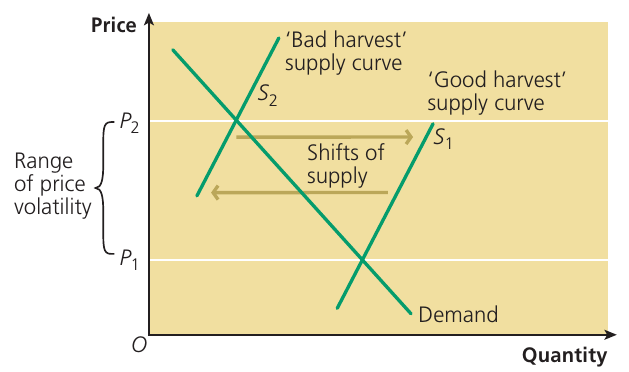
Agricultural markets experience significant year-to-year price fluctuations. The diagram illustrates this volatility. In a "good harvest" year, when weather conditions are favourable, the supply curve shifts rightward, causing prices to fall. In a "bad harvest" year, poor weather conditions shift the supply curve leftward, pushing prices up. Market prices fluctuate between P₁ and P₂ depending on harvest outcomes.
Causes of agricultural supply shifts:
- Weather conditions (rainfall, temperature, frost)
- Natural disasters (floods, droughts, hurricanes)
- Pest and disease outbreaks
- Geopolitical events (such as the Russian invasion of Ukraine in 2022, which disrupted global wheat supplies)
These unpredictable supply shifts create instability in farm incomes and make planning difficult for both farmers and food processors. Governments often intervene in agricultural markets to try to stabilise prices, though such interventions can create their own problems.
Using cross elasticity of demand
When studying interrelated markets, cross elasticity of demand becomes a valuable analytical tool. This measures how demand for one good responds to a price change in a related good.
Understanding cross elasticity values:
-
Positive cross elasticity: Indicates substitute goods in competitive demand. If the cross elasticity of demand for good A with respect to good B is +0.8, this means a 10% price increase in good B will increase demand for good A by 8%.
-
Negative cross elasticity: Indicates complementary goods in joint demand. If goods are consumed together, a price rise in one reduces demand for both.
Cross elasticity helps economists quantify the strength of relationships between markets. A high positive value indicates close substitutes (strong competitive demand), while values close to zero suggest goods are largely independent.
Key Points to Remember:
-
Joint supply means producing one good automatically creates another product, typically lowering its price when the main product's demand increases
-
Competitive demand occurs between substitute goods - when one's price rises, demand for the other increases
-
Composite demand involves goods with multiple uses - increased demand for one use reduces supply for alternative uses
-
Derived demand means demand for inputs depends on demand for the final product they help create
-
Agricultural markets face both long-run price declines (due to productivity improvements) and short-run volatility (due to harvest variations)
-
Cross elasticity of demand provides a quantitative measure of how strongly related two goods are in terms of substitution or complementarity