Economies and Diseconomies of Scale (AQA A-Level Economics): Revision Notes
Economies and Diseconomies of Scale
Introduction to scale concepts
When a firm grows by investing in new plant, equipment or buildings, it can experience changes in its average costs of production. These changes depend on whether the firm benefits from economies of scale or suffers from diseconomies of scale.
Economies of scale occur when a firm increases its size or scale of production and, as a result, the long-run average cost per unit falls. This means larger firms can produce goods more cheaply than smaller firms.
Diseconomies of scale happen when a firm grows beyond an optimal size and the long-run average cost per unit begins to rise. At this point, being bigger actually makes production more expensive.
The key distinction is in the direction of cost changes: economies of scale lead to falling costs as firms grow, while diseconomies of scale lead to rising costs as firms become too large.
Understanding the long-run average cost curve
The relationship between firm size and production costs is illustrated by the Long-Run Average Cost (LRAC) curve. This curve typically has a U-shape, showing that costs initially fall as the firm expands, reach a minimum point, and then begin to rise if the firm continues to grow.
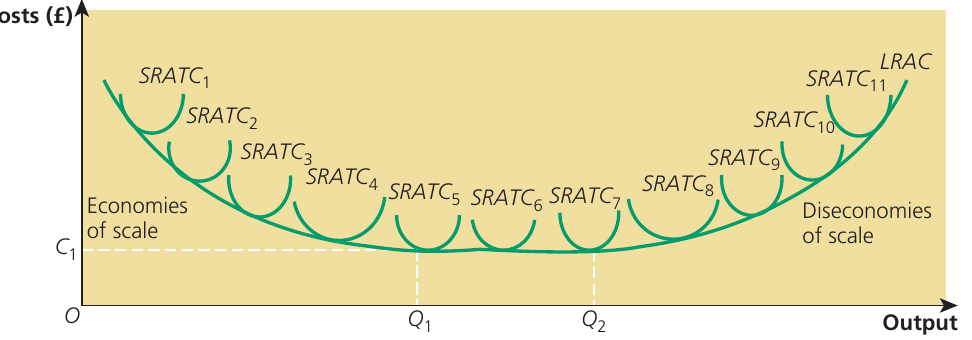
The diagram shows the LRAC curve along with multiple Short-Run Average Total Cost (SRATC) curves. Each SRATC curve represents a different firm size or scale of production that is fixed in the short run. In the long run, firms can move between these different scales by changing all their factors of production.
The LRAC curve forms an "envelope" that touches each SRATC curve at exactly one point. The left-hand side of the LRAC curve, where costs are falling, represents economies of scale. The right-hand side, where costs are rising, represents diseconomies of scale.
Internal vs external economies of scale
Critical Distinction: Understanding the difference between internal and external economies of scale is fundamental to analyzing cost behavior in firms and industries.
Internal economies and diseconomies of scale are changes in long-run average costs that result from changes in the size or scale of an individual firm or plant. These occur within the firm itself as it grows or contracts.
External economies of scale occur when a firm's average costs fall not because the firm itself has grown, but because the entire industry or market has expanded. This benefits all firms in the industry.
External diseconomies of scale happen when the growth of an entire industry causes average costs to rise for all firms within it, typically due to increased competition for resources or infrastructure congestion.
Types of internal economies of scale
As firms grow larger, they can benefit from several different types of internal economy of scale.
Technical economies of scale
Technical economies arise from changes to the productive process as production scale increases. These include:
-
Indivisibilities: Many types of machinery and plant equipment have a minimum efficient size below which they cannot operate efficiently. Larger firms can make full use of this equipment, while smaller firms cannot justify the investment or cannot run it at optimal capacity.
-
Spreading research and development costs: Large firms can spread their R&D costs over a much longer production run. When development costs are divided across millions of units rather than thousands, the cost per unit falls significantly.
-
Volume economies: With many types of capital equipment, costs increase less rapidly than capacity. For example, when a storage tank or boiler doubles in size across its three dimensions, its storage capacity increases eightfold. This creates substantial cost savings in transport, storage and warehousing industries, as well as in metal and chemical production where conservation of heat and energy matters.
Volume economies demonstrate an important principle: when dimensions double, capacity can increase by much more than double, creating significant cost advantages for larger-scale operations.
-
Economies of massed resources: When a large plant operates numerous identical machines, it needs proportionately fewer spare parts than when fewer machines are involved. This reduces inventory costs and downtime.
-
Economies of vertically linked processes: Manufacturing typically involves many vertically related tasks, from purchasing raw materials through to sale of the finished product. Linking these processes within a single large plant can save time, transport costs and energy.
Managerial economies of scale
The larger a firm becomes, the greater its ability to benefit from specialisation and division of labour within management itself. Large firms can afford specialist managers in areas such as production, personnel, finance and sales. Tasks can be delegated to junior managers and supervisors, allowing senior managers to focus on strategic decisions. This functional division of labour increases efficiency.
Marketing economies of scale
Marketing economies come in two main forms: bulk-buying and bulk-marketing.
Large firms can use their market power to negotiate lower prices when purchasing supplies in bulk. They can also negotiate better terms with wholesalers and retailers for distributing their products. These purchasing and distribution advantages reduce average costs per unit.
Financial or capital-raising economies of scale
Financial economies are similar to bulk-buying economies but relate specifically to borrowing funds. Large firms can often borrow from banks and financial institutions at lower rates of interest and on more favourable terms than those available to small firms. This is because larger firms are generally seen as less risky by lenders, having more assets to use as collateral.
Risk-bearing economies of scale
Large firms face less risk exposure than small firms because they can group and spread risks more effectively. They spread risk by diversifying their output across different products, their markets across different regions, their sources of supply across different suppliers, and their finance across different lenders. They also diversify the processes by which they manufacture output.
Risk diversification is a powerful advantage of scale. By spreading operations across multiple dimensions, large firms create a buffer against adverse changes in any single market or product line.
This diversification makes large firms less vulnerable to sudden changes in demand, supply conditions or market circumstances that might severely harm a smaller, less diversified business.
Economies of scope
Economies of scope are factors that make it cheaper to produce a range of products together rather than producing each one separately. An example would be businesses sharing centralised functions such as finance, human resources or marketing departments, which reduces the average cost of these services across all product lines.
Types of internal diseconomies of scale
As firms continue to grow beyond a certain size, they may suffer from various forms of diseconomy of scale, causing long-run average costs to rise.
Managerial diseconomies of scale
As a firm grows larger, administration becomes increasingly difficult. When managerial functions are delegated to people lower in the organisation who may lack appropriate experience or training, poor decisions can be made. This increases average costs of production as inefficiencies multiply throughout the organisation.
Common Pitfall: Many firms assume that growth always leads to greater efficiency. However, beyond a certain point, the complexity of managing a large organisation can actually increase costs rather than reduce them.
Communication failure
Communication failure is closely related to managerial diseconomies. In large organisations, there can be too many layers of management between top decision-makers and ordinary production workers. Staff at lower levels can feel remote and unappreciated, disconnected from the firm's overall goals.
When staff productivity begins to fall due to poor communication and low morale, unit costs begin to rise. The problems facing the business may not be effectively addressed because information does not flow efficiently through the management hierarchy.
Motivational diseconomies of scale
With large firms, it often becomes difficult to satisfy and motivate workers effectively. Over-specialisation may lead to de-skilling, with workers performing repetitive, boring tasks that offer little job satisfaction. Workers may have little incentive to use personal initiative or creativity in ways that would help their employer.

When workers feel like small cogs in a large machine, performing the same tasks repeatedly without variety or challenge, their motivation and productivity tend to decline, pushing up average costs.
The human factor in diseconomies of scale is often underestimated. Employee motivation and satisfaction directly impact productivity, and these can deteriorate significantly in very large organisations where workers feel disconnected from the firm's purpose.
The relationship between returns to scale and economies or diseconomies of scale
There is an important connection between the concept of returns to scale (from production theory) and economies or diseconomies of scale (from cost theory).
When a firm experiences increasing returns to scale, output increases faster than inputs. If wage rates and other factor prices remain constant at all output levels, the money cost of producing each unit of output must fall. This creates economies of scale and a falling LRAC curve.
Conversely, with decreasing returns to scale, output increases at a slower rate than inputs. The money cost of producing each unit rises, creating diseconomies of scale and a rising LRAC curve.
Beyond the impact of returns to scale on costs, there are other reasons for falling long-run average costs. These include the effect of bulk buying reducing the cost of raw materials and components, which is independent of the technical production relationship between inputs and outputs.
External economies and diseconomies of scale
External economies of scale occur when a firm's average costs fall not because of the firm's own growth, but because of the expansion of the industry or market of which the firm is part.
These often result from cluster effects, which occur when many firms in the same industry locate close to one another. This geographical concentration provides benefits such as:
- Shared access to suppliers and distribution networks
- A pool of trained labour with relevant skills
- Knowledge spillovers and innovation
- Specialised support services
Real-World Example: Technology Clusters
Technology firms clustering in areas like Silicon Valley benefit from the presence of skilled workers, venture capital, and specialised suppliers. These external economies reduce average costs for all firms in the cluster, even without any individual firm growing larger.
External diseconomies of scale occur when the growth of an entire industry raises average costs for all firms within it. When many similar firms locate close together due to cluster effects, they create problems as well as benefits:
- Competition for labour may raise local wages, increasing unit wage costs for employers
- Increased local and regional traffic congestion lengthens delivery times and raises delivery costs for both firms and their customers
- Rising demand for local property and services drives up costs
- Competition for suppliers may increase input prices
Different shapes of the long-run average cost curve
The LRAC curve can take various shapes depending on the industry and the balance between economies and diseconomies of scale.
The three-section LRAC curve
This curve has three distinct sections. Initially, there are economies of scale with falling average costs. This is followed by a horizontal section where the firm experiences constant returns to scale and average costs remain flat. Finally, diseconomies of scale set in, causing costs to rise.
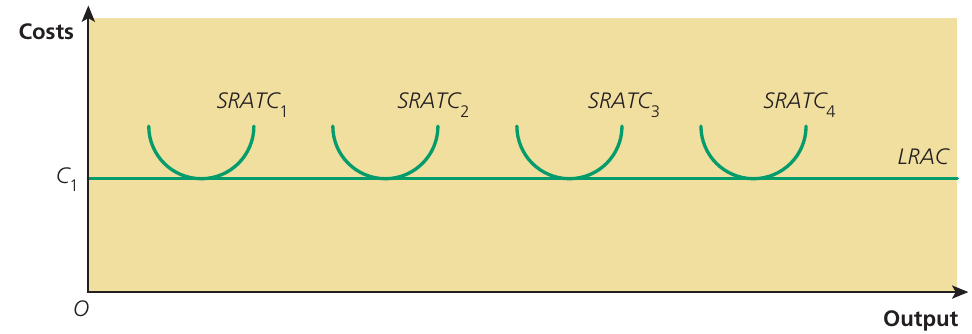
When there are constant returns to scale, the LRAC is horizontal. Each SRATC curve is tangent to the LRAC at its minimum point, and average costs remain at the same level regardless of output.
The constant returns to scale curve
Some industries may experience constant returns to scale across a wide range of output levels. In this case, the LRAC curve is horizontal throughout its length, showing that firms neither benefit from economies of scale nor suffer from diseconomies of scale. Average costs remain the same regardless of firm size.
The L-shaped LRAC curve
Another important possibility is the L-shaped LRAC curve. This curve shows substantial economies of scale which eventually flatten out rather than turning into diseconomies of scale. There is evidence of this type of curve in many manufacturing industries involving large-scale production.
The L-shaped curve indicates that once a firm reaches a certain size, it can continue to expand without experiencing rising average costs. The curve reaches its minimum point and then remains flat, suggesting that very large firms can produce just as efficiently as moderately large firms.
Curves showing small-scale or large-scale economies
LRAC curves can also be "skewed" to show industries where either small firms or large firms have particular advantages.
A curve skewed to the left shows that diseconomies of scale set in early. This explains why small firms are common in service industries such as hairdressing or personal training. These markets typically possess economies of small-scale production, where diseconomies set in quickly, making small operations more efficient.
A curve skewed to the right shows economies of large-scale production. Diseconomies of scale only set in after substantial economies of scale have been achieved. This pattern is common in heavy manufacturing and capital-intensive industries.
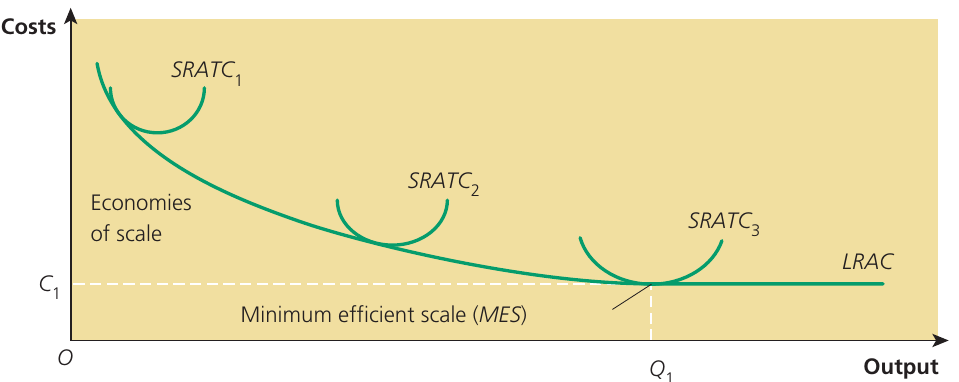
The concept of minimum efficient scale
Minimum Efficient Scale (MES) is the lowest output level at which long-run average costs have been reduced to the minimum that can be achieved, meaning the firm has benefited to the full from economies of scale.
At the MES point, the firm is producing at the lowest possible average cost. All firm sizes to the left of the MES curve are operating below minimum efficient scale, incurring higher average costs than necessary. In contrast, there would be no further reductions in long-run production costs for any firms producing output levels above the MES.
The LRAC curve and the SRATC curve form a tangent at the point where average costs are minimised. At this point, the firm is operating at its most efficient size, having fully exhausted all available economies of scale without yet experiencing any diseconomies of scale.
Different industries have different MES levels. Industries with high MES tend to be dominated by large firms (such as automobile manufacturing or steel production), while industries with low MES support the existence of many small firms (such as restaurants or retail shops).
Long-run marginal costs
Long-Run Marginal Cost (LRMC) shows the additional cost incurred when a firm increases output and all factors of production are variable. The mathematical relationship between LRMC and LRAC is the same as that between SRMC and SRATC.
The relationship between LRMC and LRAC helps explain the shape of the LRAC curve:
- When long-run marginal costs are below long-run average costs, the LRAC curve falls. This indicates economies of scale.
- When long-run marginal costs are above long-run average costs, the LRAC curve rises. This indicates diseconomies of scale.
- When the LRMC curve cuts through the lowest point on a LRAC curve, the LRAC curve must be U-shaped, displaying first economies of scale and then diseconomies of scale.
Real-world applications
The car industry
Industry Application: Automobile Manufacturing
Car manufacturing in the twentieth century became one of the most important industries benefiting from economies of scale. The development of the moving assembly line, which allowed factories to benefit from technical economies of scale, marked the beginning of mass production.
However, economies of scale in car production are now less important than they once were. Several factors explain this change:
- Market fragmentation: With car buyers demanding a wider variety of vehicles, production runs have become smaller
- Changes in production methods: There is less need for huge, capital-intensive factories. Manufacturers are increasingly outsourcing components to outside suppliers
- Flexible manufacturing: New production techniques allow manufacturers to build cars to order rather than in large batches of identical vehicles
The concept of barriers to entry is relevant here. As car companies produce an ever-wider range of vehicles, the way cars are made is changing, and capital-intensive factories are becoming less critical. This means barriers to entry into the car industry are falling, potentially allowing smaller manufacturers to compete.
Oil tankers and volume economies
Technical Example: Volume Economies in Shipping
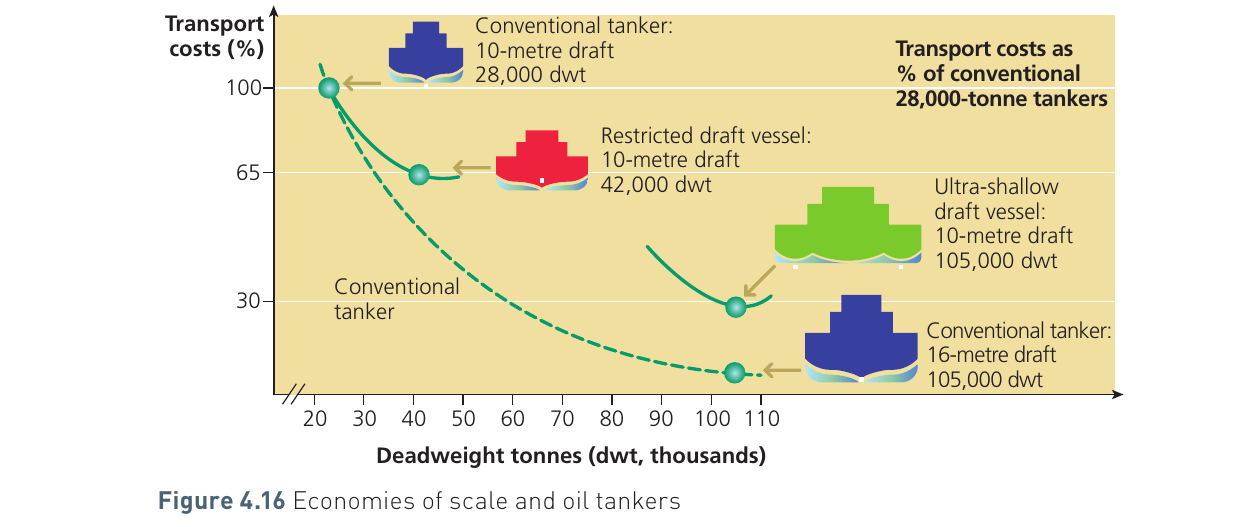
The oil tanker industry provides an excellent example of volume economies of scale. Large super-tankers used to transport crude oil across seas and oceans benefit significantly from volume economies.
The graph shows how transport costs (as a percentage of conventional tankers) decrease as vessel size increases. A conventional tanker with a 10-metre draft and 28,000 deadweight tonnes (dwt) has a transport cost of 100%. As vessel size increases, costs fall dramatically.
However, super-tankers can also suffer from a diseconomy of scale. Very large super-tankers cannot enter shallow ports, limiting where they can deliver their cargo. A wider tanker with a shallow draught does not yield as many economies of scale as a conventional super-tanker, but it offers more flexibility and can enter more ports.
This demonstrates that the optimal size for a vessel depends on balancing the cost savings from economies of scale against the operational constraints and potential diseconomies that arise from excessive size.
Key Points to Remember:
-
Economies of scale cause long-run average costs to fall as output increases, while diseconomies of scale cause long-run average costs to rise as output increases.
-
Internal economies and diseconomies result from changes within the firm itself, including technical, managerial, marketing, financial, and risk-bearing factors. External economies and diseconomies result from the growth of the entire industry or market.
-
The LRAC curve is typically U-shaped, with the downward-sloping section showing economies of scale and the upward-sloping section showing diseconomies of scale. The curve forms an envelope touching multiple SRATC curves.
-
Minimum Efficient Scale (MES) is the output level where long-run average costs reach their minimum and economies of scale are fully exhausted. Industries with high MES tend to have large firms, while those with low MES support many small firms.
-
Different industries show different LRAC curve shapes depending on their production characteristics: some show constant returns to scale, others are L-shaped with sustained economies of scale, and some are skewed to favour either small-scale or large-scale production.