Core Skills (AQA A-Level Geography): Revision Notes
Core Skills
Geography requires a range of fundamental abilities that support all geographical work. These essential competencies form the foundation for successful investigations and analysis.
Understanding core geographical skills
Core skills are the basic capabilities needed to carry out geographical work effectively. These include:
- Literacy skills: The ability to write clear reports and interpret written information accurately
- Numeracy skills: Skills needed to measure data accurately and perform relevant calculations
- Visual communication: Creating and interpreting maps, sketches, and diagrams
These abilities underpin all geographical investigations, from fieldwork to data analysis.
Sketch maps
Sketch maps are hand-drawn maps that show geographical features and locations. Whilst they don't require artistic talent, they must be clear and properly labelled to be useful.
Essential elements of sketch maps
Every properly drawn sketch map must include five key components:
- Title or location: Clearly identifies the place shown
- Key: Explains all symbols used on the map
- Annotations or labels: Text that explains, elaborates on, or emphasises particular features
- Scale indication: Shows distances or relative sizes
- North pointer: Indicates direction and orientation
Understanding the difference between annotations and labels:
Annotations typically contain more than 10 words and provide detailed explanations, whereas labels are shorter (fewer than 10 words) and simply identify features.
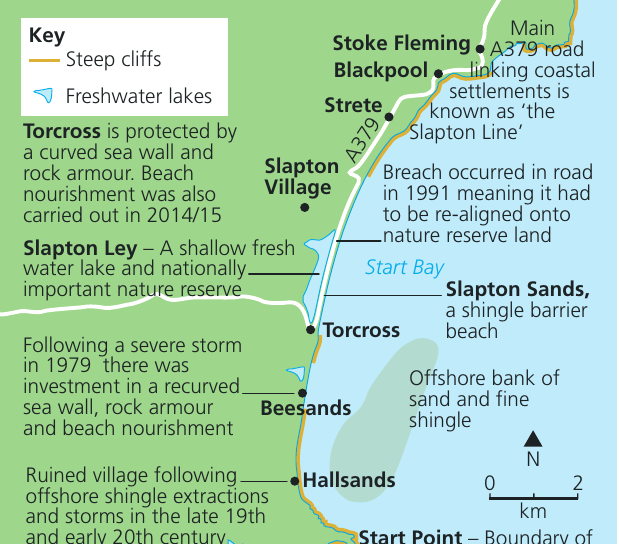
The sketch map above demonstrates how these elements work together. Notice the key explains symbols, annotations provide detailed information about coastal processes, and the scale and north pointer help readers understand the geography.
Field sketches and photographs
Field sketches and photographs serve as valuable tools for recording observations during geographical investigations, particularly in physical geography studies.
Using field sketches
Field sketches help you highlight and record specific landscape features you want to identify and possibly comment on later. They are especially useful when investigating physical landscapes like glaciated or coastal areas.
The technique doesn't demand artistic ability. Your priority should be creating a clear drawing with accurate and useful labels rather than producing an artistic masterpiece.
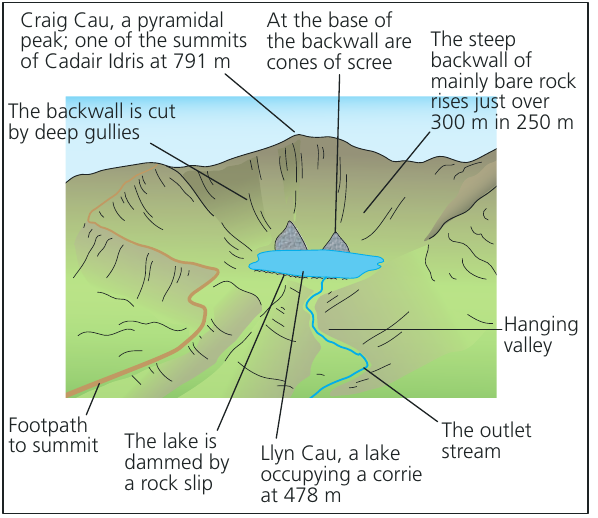
This field sketch of a glacial landscape shows how you can effectively record landforms. Notice how labels identify key features like the pyramidal peak, backwall, hanging valley, and outlet stream.
Using photographs
Photographs can supplement field sketches, but you must use them appropriately:
- Don't include photographs simply as 'space-fillers'
- Every photograph must be annotated or labelled
- Annotations can be added digitally or using an acetate overlay
- The photograph should direct the reader to specific information it shows
Common mistake to avoid:
Never include photographs without proper annotations. They must serve a clear purpose in your investigation and direct readers to specific geographical information.
Ordnance Survey maps
Ordnance Survey (OS) maps are detailed maps available at various scales. Each grid square contains substantial geographical information about both physical and human landscapes.
Key OS map skills
You need to develop these abilities when working with OS maps:
- Working out location: Using grid references to identify precise locations
- Using scale and direction indicators: Understanding distances and orientation
- Interpreting contour patterns: Reading the physical landscape and understanding relief
- Describing settlement form and function: Analysing human geography features
- Inferring land use: Understanding how the land is being used based on map symbols
Creating cross sections
OS maps allow you to construct cross sections of physical landscapes. These diagrams show the shape of the land as if you've sliced through it vertically. Cross sections are particularly useful in fieldwork reports to illustrate landscape features, though they won't be directly examined.
Geographical Information Systems (GIS)
Key Definition:
Geographical Information Systems (GIS) are computer-based tools that collect, store, process, and display information linked to locations or maps.
GIS technology has become central to modern geographical study. Environmental planners, government departments, utility companies, and commercial organisations use these systems extensively.
What GIS can do
GIS systems offer several powerful capabilities:
- Question and understand data: Help interrogate datasets to find patterns
- Handle complex data: Enable multiple interrogation of complicated information
- Illustrate abstract concepts: Present difficult ideas in a visual, dynamic way
- Create 3D representations: Make use of three-dimensional visualisations
- Support decision making: Provide opportunities for modelling different scenarios
Types of GIS maps
GIS software produces maps in two main formats:
Raster maps are created using coloured dots or pixels, similar to high-quality digital photographs. Digital versions of OS maps typically appear in raster format.
Vector maps record each feature (such as roads, buildings, or woodland) using XY coordinates. This format enables information from spreadsheets and databases to link directly to map features. You can add these layers to a base map when needed. GoogleMaps exemplifies vector mapping in action.
GIS in action
One practical application occurred in February 2020 when the Environmental Systems Research Group (Esri), a California-based GIS software supplier, launched a COVID-19 GIS hub. This centralised system aimed to:
- Aid real-time monitoring of the pandemic
- Catalogue GIS data supporting mapping and analysis
- Increase community preparedness with public health resources
The system successfully provided regular updates from different health organisations, reporting confirmed cases, deaths, and recoveries from coronavirus.
Cartographic skills
Cartographic skills involve working with various types of maps. These skills fall into two main categories:
- Reading and interpreting maps (such as atlas and weather maps)
- Producing maps to present information (such as sketch maps)
Atlas maps
Key Definition:
An atlas is a collection of maps based on a single theme (like a road atlas) or covering a series of themes (physical, political, population, resources, etc.).
Academic atlases require you to understand and use lines of latitude and longitude to identify and describe locations. You also need to understand how colour and symbols convey different types of information.
Atlases contain large amounts of data that prove useful when studying and comparing countries or regions. In our rapidly changing world, it's important that atlases are kept up to date.
Weather maps
Key Definition:
A synoptic weather chart (or map) summarises the current weather situation in weather terms.
These charts show:
- Pressure patterns
- Fronts
- Wind direction and speed
- How conditions will change and evolve over the coming days
Weather maps and synoptic charts become especially useful when planning fieldwork. They not only indicate what weather to expect but also explain why particular weather conditions are occurring. The most detailed weather chart type you're likely to encounter is the Atlantic chart.
Maps with located proportional symbols
These maps include symbols whose area or volume is proportional to the value they represent. Representative symbols can take various forms:
- Squares
- Circles
- Small graphs (bar graphs or pie charts)
These symbols are placed on a map to show spatial differences across an area.
When creating proportional symbol maps, take great care in placing symbols. Whilst you must avoid excessive overlap (which makes the map confusing), you also need to ensure it's clear which area or place each symbol represents.
Remember!
Key Points to Remember:
- Core skills include literacy, numeracy, and visual communication abilities that underpin all geographical work
- Sketch maps must always include five elements: title, key, annotations/labels, scale, and north pointer
- Field sketches and photographs must be properly annotated to be useful—they're not just decorative space-fillers
- Ordnance Survey maps require specific skills including reading grid references, interpreting contours, and understanding map symbols
- GIS systems are powerful digital tools that store, analyse, and display spatial data in both raster and vector formats
- Cartographic skills involve both reading different map types (atlases, weather charts, proportional symbol maps) and creating maps to present information effectively