Investigating Coastal Processes (AQA A-Level Geography): Revision Notes
Investigating Coastal Processes
Introduction
Understanding how coastal processes shape beaches is essential for geography students. By collecting field data, you can learn about the effects of wave action and longshore drift on coastal environments. This investigation focuses on examining three key aspects of a beach: its shape, the quantity of beach material in different locations, and the characteristics of that material.
Field investigations provide first-hand evidence of how natural processes continuously reshape our coastlines. The systematic approach described in this guide allows you to collect reliable data that reveals patterns in coastal geomorphology.
Setting up a coastal investigation
Establishing transects
A transect is a straight line that runs from the shoreline to the back of the beach. This line provides a systematic way to collect data across the entire beach profile.
To set up a transect:
- Position the line at regular intervals along the length of the beach (typically every 5-10 metres, depending on beach length and time available)
- Mark the starting point at the water's edge (always begin here as tides may advance)
- Extend the line inland to the back of the beach
- Record the total length using a tape measure
- Note the orientation using a compass
- Record the position on a base map using a grid reference
Safety First: Always establish transects from the water's edge working inland. This approach ensures you won't be caught by incoming tides, which can advance rapidly on some beaches. Check tide times before beginning your fieldwork.
The spacing between transects depends on your investigation aims. Completing transects at 10 or more sites spread systematically along the beach allows you to analyze how waves and tides sort material along the coastline. This systematic approach reveals patterns in sediment distribution.
Collecting data along transects
Along each transect, measure data at regular intervals. The distance between measurement points varies based on transect length and available time. The beach surface often shows obvious changes in angle, called breaks of slope. Recording data at these natural breaking points, rather than at fixed intervals, can provide a more accurate representation of the beach profile when you plot it later in class.
Beach profiling techniques
Beach profiling involves measuring the gradient (slope) of different sections across the beach. This technique requires two people working together.
Step-by-step method
Worked Example: Measuring Beach Gradient
The process for measuring beach gradient works as follows:
- Student 1 positions a ranging pole at the seaward end of the transect
- Student 2 takes a second ranging pole and walks up the beach to the first break of slope
- Measure the distance between the two poles using a tape measure
- Student 1 uses a clinometer to measure the angle between the tops of the two ranging poles
- This angle represents the gradient of that beach section
- Record both the distance and gradient
- Repeat this process for each break of slope until you reach the top of the beach
This systematic approach builds up a complete profile showing how the beach surface changes from the water's edge to the backshore.

The profile data can later be used to calculate the cross-sectional area at each location, which indicates the volume of beach material present at that point.
Analyzing sediment characteristics
Understanding sediment properties helps explain how wave energy and longshore drift sort materials along the coast.
Measuring pebble size
At each data collection point on your transect, select a sample of at least 10 pebbles. You can use a quadrat placed randomly to ensure unbiased selection.
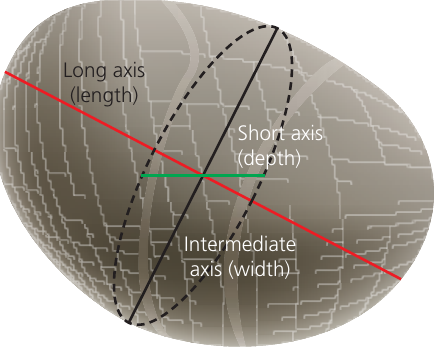
Understanding Pebble Axes
Pebbles have three axes of different lengths:
- Long axis (length): the longest measurement
- Intermediate axis (width): the middle measurement
- Short axis (depth): the shortest measurement
Measuring all three axes provides a complete picture of pebble size and shape, essential for understanding how wave action has processed the sediment.
Measure each axis using a ruler or calipers. Take measurements from multiple pebbles and calculate an average size. This method works for coarse beach material. If the beach consists of fine sediment, use graduated sieves instead. Pass a sample of sediment through the sieves to determine the average grain size at each location.
Assessing pebble roundness
Power's Roundness Scale is a classification system that categorizes pebbles from very angular, through sub-angular and rounded, to very rounded. This scale helps quantify how much waves have worn down the sediment.
Assess each pebble in your sample against an exemplar chart showing the different categories. Record the roundness value for each pebble, then calculate an average for that location. Angular pebbles indicate less wave action or shorter transport distances, while rounded pebbles suggest extensive processing by waves over time or distance.
Recording and organizing data
Systematic data recording ensures you can analyze your findings effectively. Use a structured table to record all measurements.
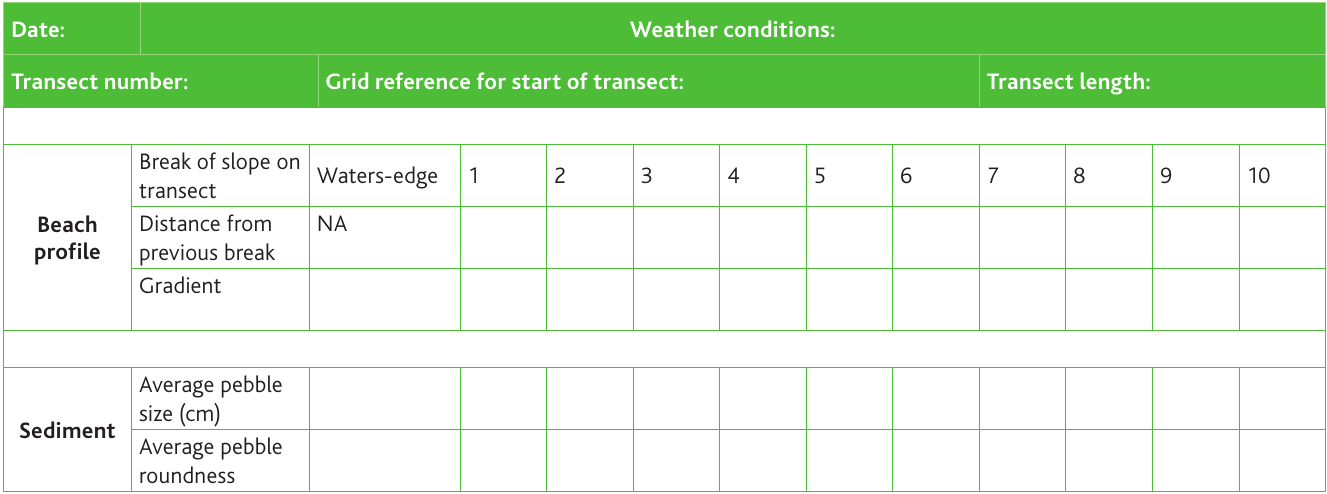
Your recording sheet should include:
Header information:
- Date of survey
- Weather conditions
- Transect number
- Grid reference for transect start
- Total transect length
Beach profile data (recorded at each break of slope):
- Position along transect (water's edge, then numbered points 1-10)
- Distance from previous break of slope
- Gradient angle
Sediment data (recorded at each sampling point):
- Average pebble size in centimetres
- Average pebble roundness value
Maintaining consistent recording methods across all transects is crucial for valid comparisons. Ensure all team members use the same measurement units and recording conventions before beginning fieldwork.
Interpreting findings
Back in the classroom, analyze your results to draw conclusions about beach characteristics from the water's edge to the top of the beach. The profile data allows you to plot the cross-sectional shape of the beach, revealing how the beach surface changes with distance inland.
Calculate the cross-sectional area at each transect location. This calculation provides an assessment of beach material quantity at different points along the coast. Comparing these values helps identify where material accumulates or depletes.
If you collect measurements at the same locations on different dates, you can assess how sediment quantities change over time. This temporal analysis helps reveal the effects of wave action and longshore drift. When only single-visit data is available, comparing profile and sediment characteristics between transects along the beach still allows you to draw conclusions about longshore drift and wave action effects.
Statistical Analysis
Statistical analysis of multiple transects (ideally 10 or more) can reveal whether differences in gradient or sediment size along the beach are significant. This analysis strengthens your conclusions about how coastal processes sort and redistribute beach material. Consider using statistical tests to determine if observed patterns are meaningful or could have occurred by chance.
Case study: The Sundarbans, Bangladesh
Background and location
The Sundarbans represents a contrasting coastal environment to typical UK beaches. This coastal zone contains the world's largest delta, extending over 10,000 km² across southern Bangladesh and India on the Bay of Bengal. The delta formed from sediment deposited by three of Earth's great rivers: the Ganges, Brahmaputra, and Meghna.
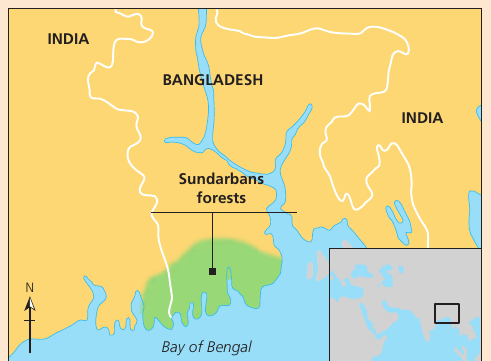
The natural climax ecosystem in this region consists of mangrove forests and swamps, creating a distinctive coastal landscape very different from the beaches typically investigated in UK fieldwork.
Coastal processes
Tidal action represents the primary natural process shaping this coastline. A dense, well-developed network of interconnecting river channels flows across the clay and silt deposits. The traditional location of larger channels remains relatively static due to the resistant nature of these silts and clays.
Comparing Coastal Processes
Unlike UK beaches where wave action dominates, the Sundarbans coastline is shaped primarily by tidal currents. This contrast demonstrates how different processes create distinctive coastal landforms and ecosystems. Understanding these variations helps geographers appreciate the diversity of coastal environments globally.
These larger channels generally run straight and reach widths of up to two kilometres or more. They flow generally north to south because of strong tidal currents. The extensive network of smaller interconnecting channels, called khals, drains the land with each powerful ebb tide.
The non-cohesive sediments like sand get washed out of the delta and deposited on banks, or chars, at river mouths. At these locations, strong south-westerly monsoon winds blow the sand into large ranges of sand dunes, creating distinctive coastal landforms shaped by both fluvial and aeolian processes working together.
Key Points to Remember:
- Always establish transects from the water's edge working inland to avoid being caught by incoming tides
- Beach profiling requires systematic measurement of gradient at each break of slope using ranging poles and a clinometer
- Sediment analysis examines both size (using rulers/calipers or sieves) and roundness (using Power's Scale)
- Multiple transects along a beach allow you to identify patterns in sediment sorting caused by longshore drift and wave action
- Contrasting coastlines like the Sundarbans delta demonstrate how different processes (tidal action vs. wave action) create distinctive coastal landscapes
- Recording data systematically using a structured table ensures effective analysis back in the classroom