Management of Natural Hazards (AQA A-Level Geography): Revision Notes
Management of natural hazards
Managing natural hazards effectively is essential to reduce loss of life and property damage. The way people perceive hazards influences how they respond, and various strategies exist to manage these threats. This note explores perception, management approaches, and the cycles involved in responding to and recovering from hazard events.
Understanding hazard perception
People react differently to natural hazards based on how they perceive and process information about risks. Several factors shape these perceptions:
- Socio-economic status
- Level of education
- Occupation and employment status
- Religion and cultural/ethnic background
- Family and marital status
- Past experiences with hazards
- Personal values, personality and expectations
Perception ultimately determines what actions people take to modify hazard events or their expected responses. Understanding these perception factors is crucial for developing effective hazard management strategies.
The difference between wealthy and poor populations is particularly significant. Wealthier people and countries can better protect themselves through sea defences, earthquake-resistant buildings, and superior emergency services. They can also increase awareness through education. In contrast, poorer communities face greater vulnerability as urban areas expand into hazardous zones like steep hillsides prone to landslides or low-lying coastal areas at risk from storms and tsunamis.
Three main types of perception
People perceive natural hazards in three distinct ways:
1. Fatalism (acceptance): Some communities view hazards as natural events that are simply part of living in an area. They may describe them as "God's will". Action tends to focus on safety rather than prevention. Losses are accepted as inevitable, and people remain where they live.
2. Adaptation: People recognise that they can prepare for and survive hazard events through prediction, prevention and protection. This depends on economic and technological circumstances available in the area.
3. Fear: The hazard is perceived as so threatening that people feel unable to continue living in the area. They relocate to regions they believe are unaffected by the hazard.
Wealthier areas generally believe that better preparation leads to better ability to withstand hazards and possibly prevent disasters. This view relies on government and community action backed by capital and technology. In poorer countries, feelings of helplessness increase with poverty levels. Even in wealthy nations, disadvantaged groups often view hazards as unavoidable aspects of life.
Approaches to managing natural hazards
Authorities and communities use several key strategies to manage hazard risks and reduce their impact. These are often referred to as the "4 Ps" of hazard management: Prediction, Prevention, Protection, and Preparedness.
Prediction

Prediction – The ability to forecast a hazardous event and then give warnings so that action can be taken to reduce their impact. Improved monitoring, information and communications technology have meant that this has become more important and accurate in recent years.
Prediction allows warnings to be issued so people can take action. The key is improved monitoring which enables accurate predictions and timely warnings.
Real-World Application: National Hurricane Centre
The National Hurricane Centre in Florida demonstrates effective prediction through comprehensive monitoring systems that include:
- Satellite imagery and tracking
- Land-based weather equipment
- Air-based reconnaissance and recordings
This multi-layered approach enables accurate forecasting and timely warnings to coastal populations.
Prevention
For natural hazards, prevention is largely unrealistic. However, some ideas have been explored, such as seeding clouds in tropical storms to increase precipitation. Theoretically, this could weaken the system as it approaches land, though this remains unproven.
Protection
Protection aims to safeguard people, their possessions and the built environment from hazard impacts. This typically involves:
- Modifications to infrastructure (improved sea walls, earthquake-proof buildings)
- Changing public attitudes and behaviour towards natural hazards to reduce vulnerability
Community preparedness/risk sharing
Community preparedness/risk sharing – This involves prearranged measures that aim to reduce the loss of life and property damage through public education and awareness programmes, evacuation procedures, the provision of emergency medical, food and shelter supplies and the taking out of insurance.
Governments can influence behaviour to reduce vulnerability. Community preparedness includes:
- Education programmes and awareness campaigns
- Evacuation procedures
- Emergency supplies of medical care, food and shelter
- Insurance schemes (including modifications to losses in wealthier areas and international aid in poorer regions)
Integrated risk management
Integrated risk management – The process of considering the social, economic and political factors involved in risk analysis; determining the acceptability of damage/disruption; deciding on the actions to be taken to minimise damage/disruption.
Modern hazard management emphasises efficiency through careful planning and information gathering. The goal is to make the most effective use of available resources to confront natural hazards.
Resilience – The sustained ability of individuals or communities to be able to utilise available resources to respond to, withstand and recover from the effects of natural hazard events. Communities that are resilient are able to minimise the effects of the event, enabling them to return to normal life as soon as possible.
Community resilience represents a crucial concept in modern hazard management. Think of resilient communities as "rubber band communities" – they can stretch under pressure but bounce back to their original state (or even stronger) after a disaster.
The risk management process
Integrated risk management incorporates several key components:
- Identification of the hazard
- Analysis of the risks
- Establishing priorities
- Treating the risk and implementing a risk reduction plan
- Developing public awareness and a communication strategy
- Monitoring and reviewing the entire process
Case Study: New Zealand's Risk Management Approach
The New Zealand government provides an excellent example of systematic integrated risk management. Their approach demonstrates how careful planning and comprehensive monitoring can create an effective national hazard management system.
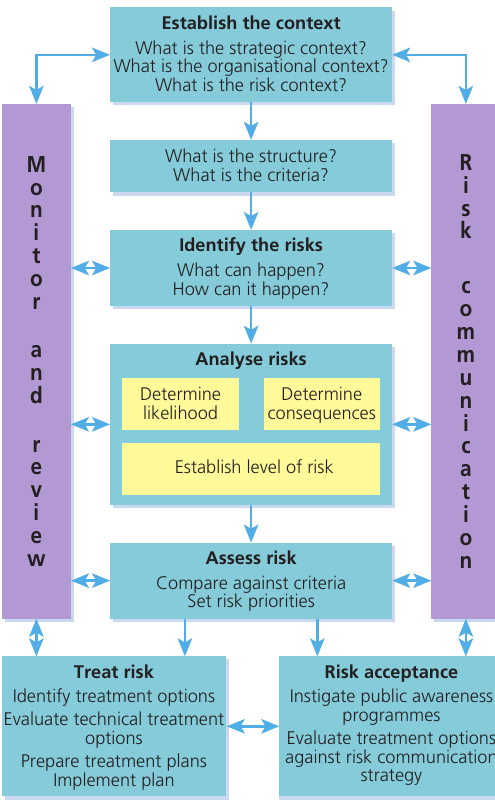
This model shows the cyclical nature of risk management, with continuous communication and monitoring throughout all stages.
Evaluating management success
All management attempts must be assessed for effectiveness. Success stories demonstrate what can be achieved:
- Using dynamite to divert lava flows on Mt Etna
- Pouring sea water onto lava flows in Iceland
However, even the well-prepared Japanese government was overwhelmed in 2011 by an earthquake in north-eastern Japan that triggered a tsunami. This event killed 15,894 people with 2,500 reported missing. Hundreds of thousands of buildings were destroyed or badly damaged. The Japanese government estimated the final cost at US $200 million.
This demonstrates that even the most sophisticated management systems can be challenged by extreme events.
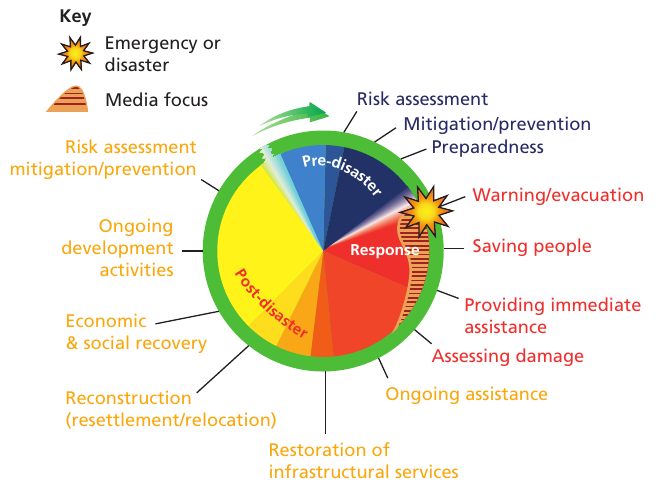
The disaster/risk management cycle
The disaster/risk management cycle illustrates the ongoing process by which governments, businesses and society plan for and reduce disaster impacts, react during and immediately following events, and take recovery steps after events occur. Appropriate actions at all cycle points lead to greater preparedness, better warnings, reduced vulnerability, and prevention of hazard events in future cycles.
The cycle shapes public policy and plans that either modify hazard causes or mitigate their effects on people, property and infrastructure.
A main goal of disaster management, strongly linked to development, is promoting sustainable livelihoods and better protection and recovery during such events. Where this is achieved, people gain greater capacity to deal with disasters, and recovery becomes more rapid and long-lasting.
FEMA example
Case Study: Federal Emergency Management Agency (FEMA)
The Federal Emergency Management Agency (FEMA) was created in the USA in 1978. The agency's primary purpose is coordinating responses to disasters that have occurred in the United States and have overwhelmed local and state authority resources.
FEMA has developed major analysis programmes for:
- Floods
- Hurricanes
- Earthquakes
Their operations closely follow the disaster/risk management cycle model, demonstrating practical application of this theoretical framework.
The complete cycle includes three main phases:
Pre-disaster phase: Risk assessment, mitigation/prevention, and preparedness activities
Response phase (hours to days): Warning/evacuation, saving people, providing immediate assistance, and assessing damage
Post-disaster phase: Ongoing assistance, infrastructure restoration, reconstruction, and economic and social recovery leading to ongoing development
Mitigation – Long-term action taken to reduce or eliminate the risk to life and property from hazard events. Action is taken before, during and after disasters to break the cycle of damage and repair in hazardous areas.
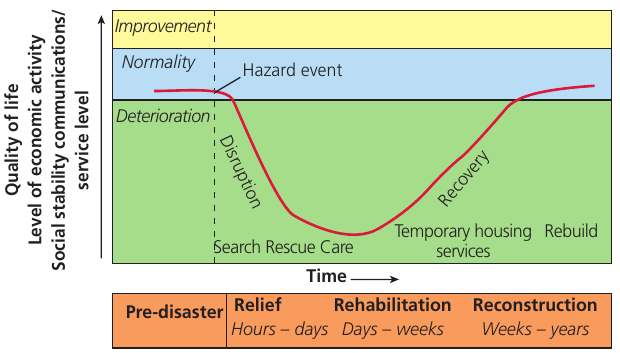
The Park model (disaster/response curve)
To show that hazard events can have varying impacts over time, Park (1991) devised his impact/response model. This model demonstrates an early stage before disaster strikes when quality of life is normal for the area.
When the hazard event occurs, quality of life suddenly drops as people take immediate action to preserve life and, if possible, protect their environment. The model resembles a valley – quality of life drops into the valley during disaster, then climbs back out during recovery.
The four stages
Pre-disaster stage: Quality of life is at a normal level for the area. People try their best to prevent events and prepare in case they happen.
Relief stage (hours to days): Medical attention, rescue services and overall care are delivered. This can last from a few hours to several days if the event has caused significant damage. From this point, the area's quality of life begins to slowly increase.
Frequency – The distribution of a hazard through time.
Magnitude – The assessment of the size of the impact of a hazard event.
Rehabilitation stage (days to weeks): People attempt to return to normal by providing food, water and shelter for those most affected. This period can last anything from a few days to several weeks.
Reconstruction stage (weeks to years): Infrastructure and property are repaired or rebuilt, and crops regrown. People use the experience to learn how to better respond to future events. This period can take from weeks to several years.
Remember the "RRR Recovery" stages after the initial relief phase:
- Relief (hours to days) – Immediate rescue and care
- Rehabilitation (days to weeks) – Providing basic necessities
- Reconstruction (weeks to years) – Rebuilding infrastructure and learning from the experience
Variations in the Park model
Different hazard events produce different impacts. This is shown by the speed of quality of life decline and the speed and nature of recovery. The difference in the three recovery trajectories could relate to:
- The type of hazard
- The degree of preparedness
- The speed of relief efforts
- The nature of recovery and rebuilding
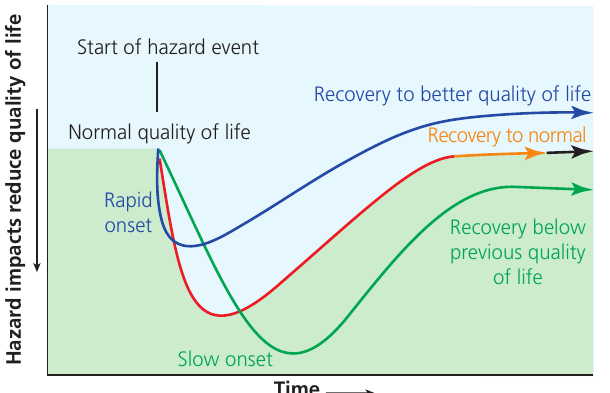
Recovery patterns vary significantly:
- Rapid onset with quick recovery (blue line): Communities recover to an improved quality of life above previous levels
- Standard recovery (red/orange line): Communities recover to normal baseline levels
- Slow onset with prolonged impact (green line): Communities experience recovery below previous quality of life standards
The effects of natural hazard events
The effects represent the impact that an event has upon both physical and human environments. Understanding the distinction between primary and secondary effects is crucial when considering hazard impacts.
Primary effects – The effects of a hazard event that result directly from that event. For a volcanic eruption these could include lava and pyroclastic flows. In an earthquake, ground shaking and rupturing are primary effects.
Secondary effects – These are the effects that result from the primary impact of the hazard event. In volcanic eruptions these include flooding (from melting ice caps and glaciers) and lahars. In an earthquake, tsunamis and fires (from ruptured gas pipes) are secondary effects.
Worked Example: Earthquake Effects
Primary effect (direct): Ground shaking and cracking of the earth's surface
Secondary effects (indirect consequences):
- Soil liquefaction
- Landslides
- Tsunamis
- Collapsing buildings
- Fires from ruptured gas pipes
- Flooding
- Long-term impacts on population
Think of it as: Primary = Direct, Secondary = Side effects
Soil liquefaction – The process by which saturated, unconsolidated soil or sand is converted into a suspension during an earthquake. It is then able to act like a liquid and flow, particularly when under pressure.
Communication systems could fail, food crop production may take time to restore, and the regional economy may be so damaged that the legacy of the hazard event persists for years.
Lava – Molten rock (magma) flowing onto the surface. Acid lava solidifies very quickly, but basic lava (basaltic) tends to flow some distance before solidifying (for example, on the Hawaiian Islands).
Distribution, frequency and magnitude
Distribution refers to the spatial coverage of the hazard. This can refer to the area affected by a single event – some have very localised effects whilst others have much wider impacts, such as tsunamis which can cross large oceans. Volcanic eruptions have been known to have global effects with dust spread in the upper atmosphere and consequent short-term climatic change.
Distribution can also refer to areas where particular hazards are likely to occur:
- Earthquakes and volcanoes are generally associated with tectonic plate boundaries
- Tropical cyclones usually occur between 5° and 25° north and south of the Equator
Frequency refers to the distribution of the hazard through time, whereas magnitude assesses the size of impact. At the most basic level, the frequency-magnitude principle leads us to expect many small insignificant events and fewer large-scale ones.
Key Points to Remember:
-
People perceive hazards differently based on wealth, education, past experience and cultural factors. The three main perception types are fatalism (acceptance), adaptation (preparation), and fear (relocation).
-
The "4 Ps" of hazard management are prediction (forecasting events), prevention (largely unrealistic), protection (modifying infrastructure and attitudes), and preparedness (education, evacuation plans, emergency supplies).
-
Integrated risk management is a systematic process that considers social, economic and political factors to analyse risks, establish priorities, and implement reduction plans with ongoing monitoring. Resilient communities can bounce back quickly after disasters.
-
The disaster management cycle has three phases: pre-disaster (risk assessment, mitigation, preparedness), response (warning, evacuation, immediate assistance), and post-disaster (ongoing assistance, reconstruction, recovery).
-
The Park model shows how quality of life drops during a hazard event then recovers through four stages: pre-disaster (normal), relief (hours-days), rehabilitation (days-weeks), and reconstruction (weeks-years). Different events show different recovery patterns.
-
Primary effects result directly from the hazard event, while secondary effects are indirect consequences. Understanding this distinction helps in planning appropriate responses and recovery strategies.