Case Study: River Catchment at a Local Scale (River Brock, Lancashire) (AQA A-Level Geography): Revision Notes
Case Study: River Catchment at a Local Scale (River Brock, Lancashire)
Location and physical characteristics
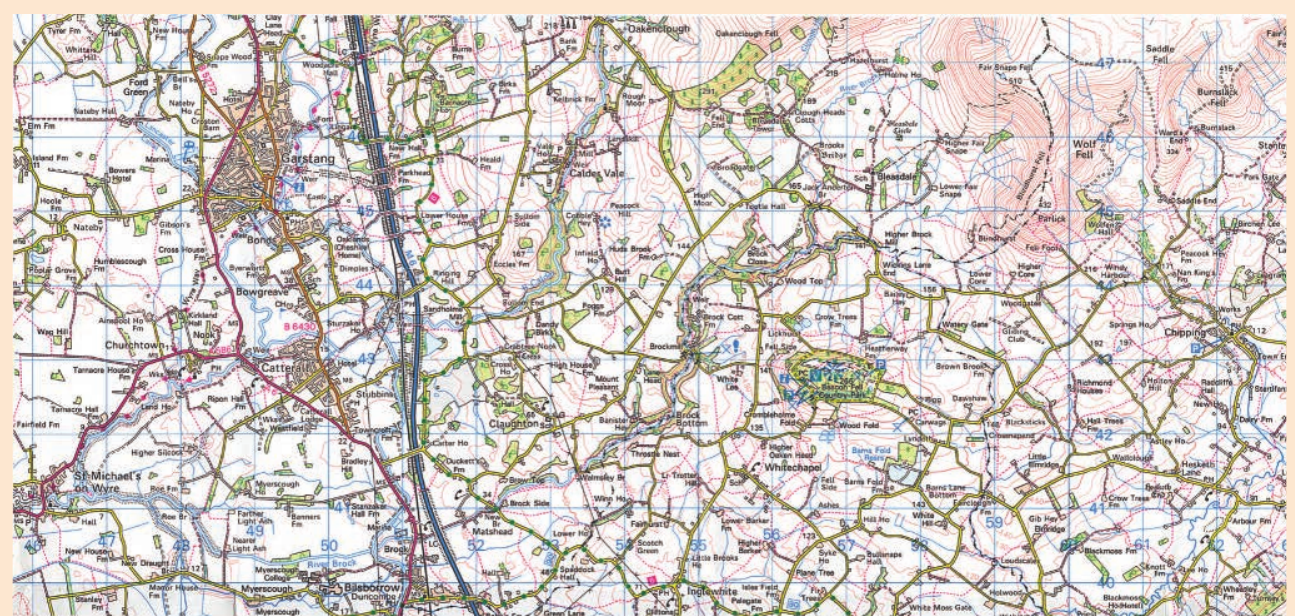
The River Brock is a small river located in Lancashire, northwest England. It flows through a completely rural catchment with minimal human interference.
Key facts about the River Brock:
- Total length: 17.8 km
- Source: Hills of the Forest of Bowland (upland area)
- The river drains water from distinctive geology in different parts of the catchment
- Upper catchment (north): Steep slopes with millstone grit hills
- Lower catchment (south): Carboniferous limestone bedrock
- Surface layer: Much of the catchment is covered by boulder clay
The river's flow remains almost entirely natural, with very limited human intervention.
Myerscough Agricultural College holds a licence permitting them to extract up to 16,592.9 m³ of water daily. However, this abstraction is currently not taking place, meaning the river maintains its natural flow patterns. This makes the River Brock an excellent case study for understanding natural river processes without significant human modification.
River regime and rainfall patterns
River regime refers to the pattern of river flow throughout the year. It is primarily controlled by the amount and timing of rainfall in the catchment area.
Rainfall variability in the catchment
The River Brock's regime shows considerable variation from year to year because rainfall amounts can differ significantly. This variability makes the river an excellent example for studying how climate influences river behaviour at a local scale.
Flow characteristics in 1995 (a relatively dry year)
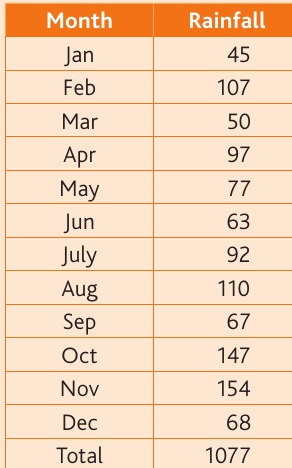
In 1995, the River Brock catchment experienced below-average rainfall. The annual total reached only 1,077 mm, which is relatively low for this region of northwest England.
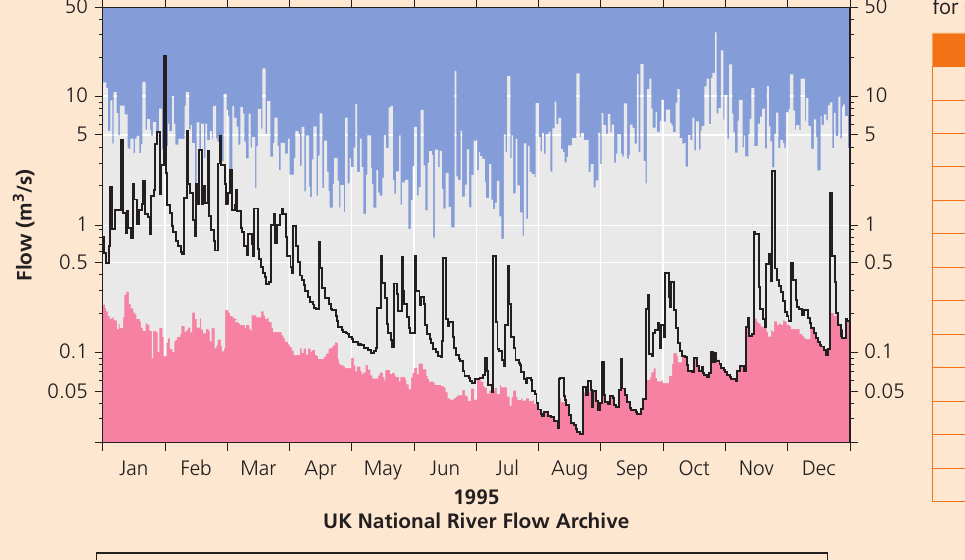
The hydrograph for 1995 demonstrates several important features:
- Winter maximum: Flow peaks occurred during late winter months when rainfall was higher
- Summer minimum: Very low flows during summer months (July-August) when rainfall decreased
- Overall pattern: Below-average discharge throughout most of the year
- Seasonal variation: Clear difference between wet and dry seasons
Understanding the Logarithmic Scale
The logarithmic scale on the discharge graph allows us to see both high and low flows clearly. During summer 1995, discharge dropped to around 0.1 m³/s, whilst winter peaks reached approximately 10 m³/s. Without a logarithmic scale, these very low summer flows would be difficult to visualize alongside much higher winter flows.
Flow characteristics in 2012 (a particularly wet year)
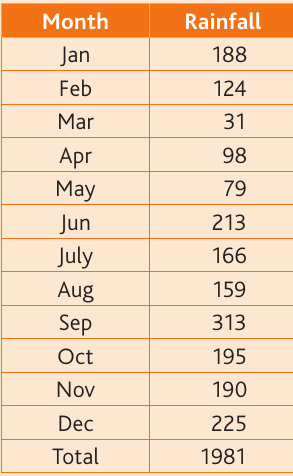
By contrast, 2012 was an exceptionally wet year for the River Brock catchment. Total annual rainfall reached 1,981 mm, nearly double the 1995 amount.
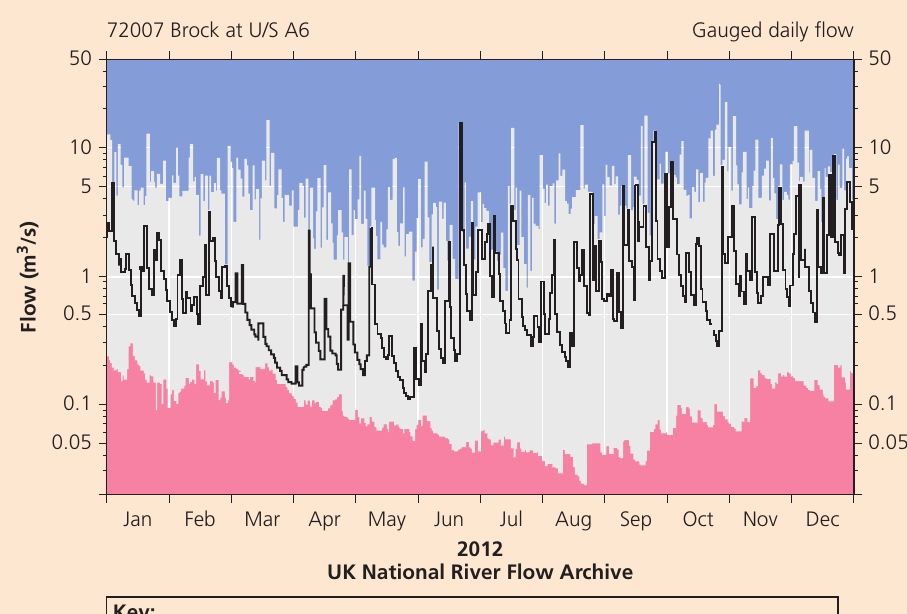
The 2012 hydrograph shows markedly different characteristics:
- Higher baseline flow: Even during drier periods, discharge remained elevated
- More frequent peaks: Regular spikes in discharge throughout the year
- Extended wet periods: Multiple months with high rainfall (notably June with 213 mm and September with 313 mm)
- Greater flow variability: More dramatic fluctuations between high and low flows
Comparing Dry and Wet Years: 1995 vs 2012
Annual rainfall comparison:
- 1995 (dry year): 1,077 mm
- 2012 (wet year): 1,981 mm
- Difference: 904 mm more rainfall in 2012 (84% increase)
Impact on river discharge:
- 2012 produced considerably higher river flows throughout the year
- More frequent flood peaks occurred in the wet year
- Summer low-flow periods were less pronounced in 2012
- The river maintained higher baseline flows even during drier months
This comparison reveals how sensitive the River Brock's discharge is to rainfall variations.
Understanding discharge measurements
Discharge data for the River Brock is collected at gauging station 72007, located upstream of the A6 road. The measurements use a logarithmic scale, which helps display both very low summer flows (as little as 0.05 m³/s) and high winter flows (up to 50 m³/s) on the same graph.
Interpreting Hydrograph Bands
The coloured bands on the hydrographs show:
- Blue area: Highest flows recorded over the period of record
- Grey area: Typical flow range for the river
- Pink area: Lowest flows recorded
The black line represents actual daily discharge measurements. When the black line approaches the blue band, flooding becomes more likely.
Downstream changes in discharge
Because the River Brock is relatively short (17.8 km), it can be studied almost from source to mouth. This allows geographers to examine how discharge changes along the river's length and compare these variations to characteristics found in other drainage basins.
Discharge typically increases downstream as more tributaries join the main channel and the catchment area grows. However, variations in geology, land use, and channel characteristics can all affect this general pattern.
Flooding on the River Brock
The October 1980 flood event
The most significant flooding to impact the area occurred in October 1980, when the village of St Michael's on Wyre experienced severe flooding. This event resulted from a combination of:
- Intense rainfall falling over a short period
- Prolonged wet weather beforehand, saturating the soil
- Rapid runoff from the steep-sided valley
The River Brock flows into the larger River Wyre, and when both rivers experience high flows simultaneously, flooding risk increases substantially in the lower-lying areas near their confluence.
Flood management strategies
Following the 1980 flooding, comprehensive flood protection measures were implemented to reduce future flood risk:
Structural measures:
-
Flood storage basin at Catterall: A large reservoir constructed north of the River Wyre with capacity to store 1.7 million m³ of floodwater. This basin temporarily holds excess water during flood events, releasing it slowly afterwards.
-
Raised embankments: Existing flood defences along the River Wyre were strengthened and heightened in lowland areas to contain higher water levels.
Non-structural measures:
-
Flood warnings: A warning system alerts residents when floods with a 1-in-5-year probability (20% annual chance) are expected.
-
Sandbag distribution: The local council maintains a stock of 2,000 sandbags for distribution during flood warnings.
-
Probability mapping: In St Michael's area south of the River Wyre, there is a 1 in 100 year probability of flooding, meaning residents receive warnings and have access to sandbag defences.
Integrated Flood Management Approach
These combined approaches demonstrate how modern flood management uses both hard engineering (physical structures like storage basins and embankments) and soft engineering (warning systems and community preparedness) to reduce flood risk. Neither approach alone would be as effective as the combined strategy.
River level and discharge monitoring
The Environment Agency continuously monitors water levels in the River Brock where it joins the River Wyre. This monitoring helps predict flood risk and understand the river's behaviour.
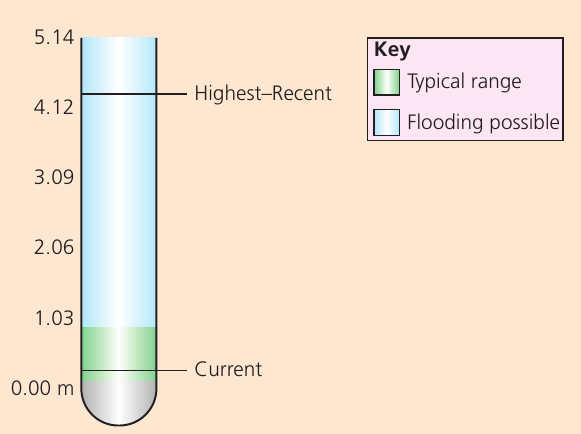
River level measurements show:
- Typical range: Between 0.12 m and 0.93 m under normal conditions
- Flooding threshold: When the level exceeds 1.03 m, flooding becomes possible
- Maximum recorded: The highest recent level reached 4.12 m during a major flood event
- Current level monitoring: Real-time data shows whether the river is within normal range or approaching flood levels
Why Valley Shape Matters for Flooding
The steep-sided nature of the Brock Valley means flooding is usually not a significant problem until the river approaches its confluence with the River Wyre. At this point, the land becomes much flatter, being a former glacial outwash plain. Whilst the river is embanked before reaching St Michael's on Wyre, the agricultural land use in this flatter area means flooding is considered a lower priority for the Environment Agency compared to protecting residential areas.
Remember!
Key Points to Remember:
-
The River Brock is a small (17.8 km), rural river in Lancashire with almost completely natural flow patterns, making it ideal for studying catchment hydrology at a local scale.
-
The river's regime is highly variable and depends on rainfall patterns, with significant differences between dry years (1995: 1,077 mm) and wet years (2012: 1,981 mm) clearly visible in discharge data.
-
The steep-sided valley, underlain by millstone grit and limestone with boulder clay cover, influences how quickly water reaches the river channel after rainfall events.
-
October 1980 flooding led to comprehensive flood management, including a 1.7 million m³ storage basin at Catterall, raised embankments, and community warning systems for the lower River Wyre.
-
Discharge monitoring using logarithmic scales allows measurement of both very low summer flows (0.05 m³/s) and high winter peaks (50 m³/s), revealing the river's seasonal regime and response to rainfall variations.