Water Balance (AQA A-Level Geography): Revision Notes
Water Balance
Understanding water balance
Water balance describes how water moves into and out of a drainage basin. Think of it as a budget - money coming in versus money going out, but with water instead. This balance involves precipitation (input), discharge, evapotranspiration (outputs), and storage.
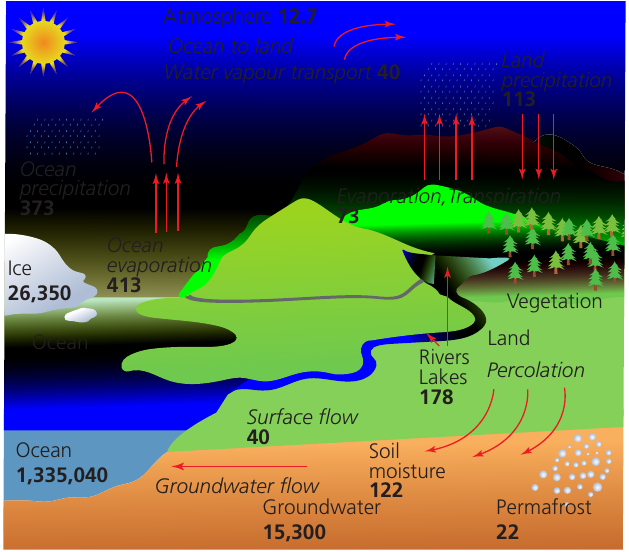
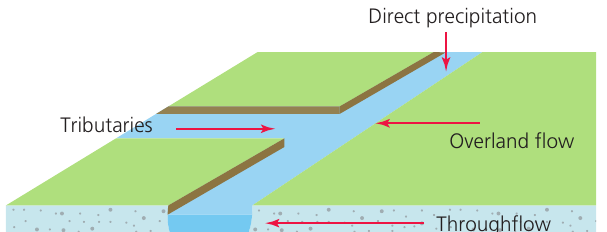
The concept is crucial for understanding river behaviour, flood risk, and water resource management. When stores can release water, there may be direct precipitation into rivers or overland flow. Larger rivers also receive water from their tributary streams.
The water balance (or budget) represents the relationship between inputs and outputs within a drainage basin. It can be expressed as:
Where = precipitation, = discharge, = evapotranspiration, = changes in storage
Components of the water balance
Precipitation
Precipitation is the primary input of water into the drainage basin system. It falls as rain, snow, sleet or hail and varies considerably by location and season.
Evapotranspiration
This is a combined output involving two processes:
- Evaporation: water turning into vapour from surfaces like lakes, rivers and soil
- Transpiration: water released as vapour by plants through their leaves
Temperature plays a key role here. Warmer conditions lead to higher rates of evapotranspiration. Sometimes, the atmosphere's capacity to hold water vapour exceeds the available water supply.
Potential evapotranspiration refers to how much water could be evaporated or transpired from an area if unlimited water was available. It represents the maximum possible water loss under given temperature conditions.
The difference between actual and potential evapotranspiration determines whether an area experiences water surplus or water deficit. This distinction is crucial for understanding regional climate patterns and water availability.
Storage
Water can be stored in various places within a drainage basin:
- Soil moisture (in the soil layer)
- Groundwater (deeper underground)
- Surface water (lakes, reservoirs)
- Vegetation (water held in plants)
- Ice and snow
Changes in these storage components affect how much water is available for discharge into rivers.
Discharge and run-off
Discharge represents water leaving the drainage basin through river channels. River levels rise and fall throughout the year, creating an annual pattern known as the river's regime. This pattern reflects the water balance of the area. Short-term variations also occur following heavy rainfall events.
Soil moisture budgets
A soil moisture budget tracks how water is stored in and moves through the soil across the year. It shows the changing relationship between precipitation inputs and evapotranspiration outputs.
The four phases of soil moisture
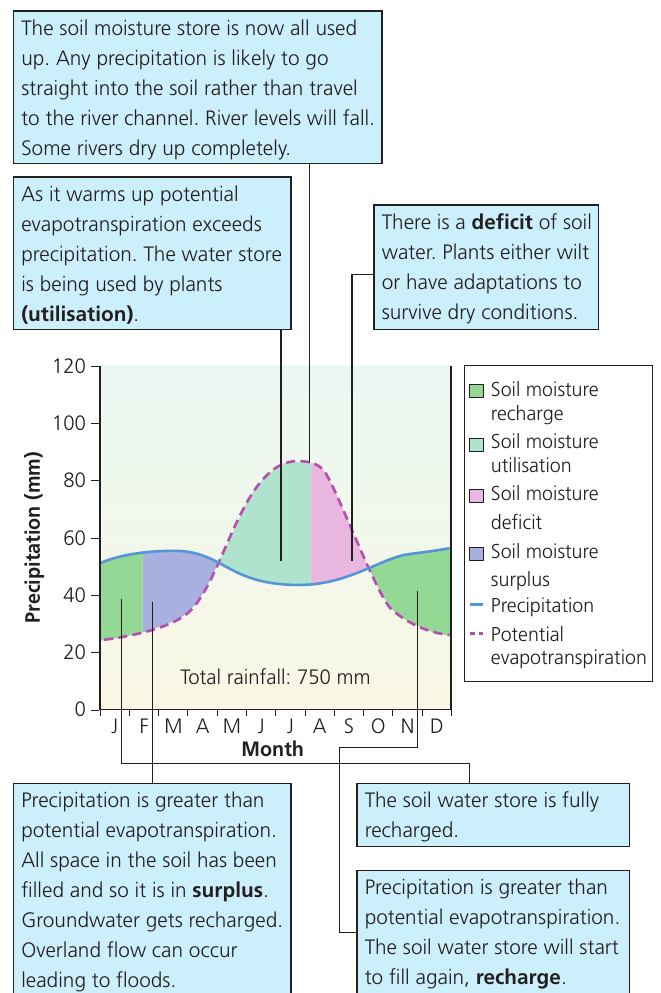
1. Soil moisture recharge
During this phase, precipitation exceeds potential evapotranspiration. The soil water store begins filling up again after being depleted. This typically occurs during cooler, wetter months when evapotranspiration rates are low.
2. Soil moisture utilisation
Here, potential evapotranspiration starts to exceed precipitation. Plants begin using water stored in the soil through transpiration. The soil moisture store is being drawn down but hasn't run dry yet.
3. Soil moisture deficit
When the soil moisture store becomes fully depleted, a deficit occurs. Precipitation cannot keep pace with potential evapotranspiration. Plants either wilt, have adaptations to survive drought, or require irrigation. Rivers may dry up completely as there's no water seeping into channels from the soil.
4. Soil moisture surplus
This happens when precipitation greatly exceeds evapotranspiration and all available soil storage is full. The excess water leads to increased groundwater recharge and overland flow. River levels rise and flooding becomes more likely.
These four phases create a cycle that repeats annually in most climates, though the timing and duration of each phase varies considerably depending on regional climate conditions. Understanding this cycle is essential for water resource management, agricultural planning, and flood risk assessment.
Regional variations in soil moisture budgets
Soil moisture patterns vary dramatically depending on climate. Let's examine three contrasting examples that illustrate how different climate types produce distinctive water balance patterns.
Temperate maritime climate: Eastern England
Eastern England experiences a temperate maritime climate with relatively even rainfall distribution throughout the year. Total annual rainfall is approximately 750mm, while potential evapotranspiration is similar.
Regional Example: Temperate Maritime Water Balance
Key characteristics:
- Winter (December-February): Precipitation exceeds evapotranspiration, creating surplus conditions. The soil water store fills completely (recharge phase). Rivers are full and flooding risk is elevated.
- Spring (March-May): As temperatures rise, evapotranspiration increases. The soil moisture store begins being used by plants (utilisation phase).
- Summer (June-August): Evapotranspiration peaks and exceeds precipitation. The soil dries out, creating deficit conditions. River levels drop as the soil cannot contribute water.
- Autumn (September-November): Evapotranspiration decreases and precipitation increases. The soil begins recharging again.
This pattern shows distinct seasonal variations with winter surplus and summer deficit.
Equatorial climate: Yaoundé, Cameroon
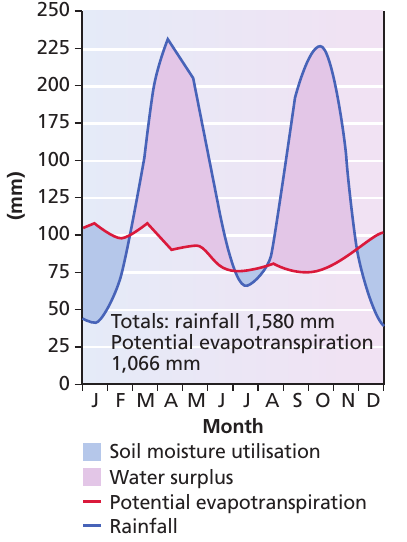
Yaoundé experiences an equatorial climate characterised by high temperatures year-round and substantial rainfall. Annual rainfall totals 1,580mm compared to potential evapotranspiration of 1,066mm.
Regional Example: Equatorial Water Balance
Key characteristics:
- Two distinct rainfall peaks occur (around April and October-November), reaching approximately 225mm per month
- Evapotranspiration remains relatively constant throughout the year (70-100mm monthly) due to consistently high temperatures
- The soil water store rarely goes into deficit because rainfall is abundant
- Water surplus conditions persist for much of the year
- Rivers maintain flow year-round, and vegetation thrives continuously
- There is potential for flooding between February and June, and again from August to November
This climate supports lush tropical rainforest ecosystems due to the consistently available water.
Tropical wet/dry climate: Navrongo, northern Ghana
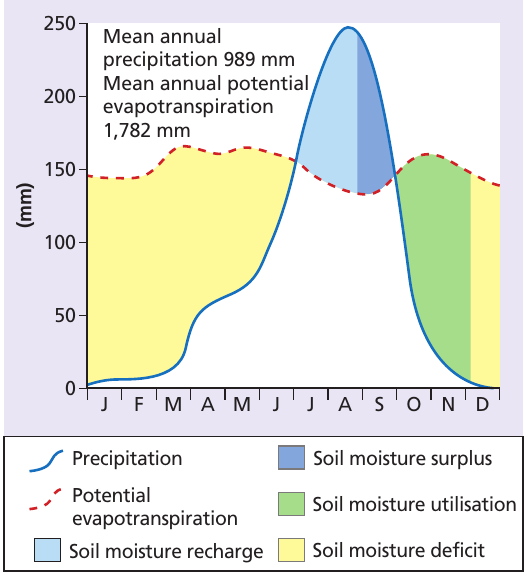
Navrongo experiences a tropical wet/dry (savanna) climate with a pronounced dry season. Mean annual precipitation is 989mm, but mean annual potential evapotranspiration is much higher at 1,782mm, indicating significant water stress.
Regional Example: Tropical Wet/Dry Water Balance
Key characteristics:
- Wet season (July-October): Rainfall peaks dramatically, with July-August receiving around 250mm. The soil recharges rapidly, creating surplus conditions. This brief period provides water for the entire year.
- Dry season (December-July): Virtually no rainfall occurs for many months. The soil experiences prolonged deficit conditions as evapotranspiration far exceeds precipitation.
- River levels fall dramatically during the dry season, with many drying up completely
- Vegetation must be adapted to survive drought (savanna grasslands, deciduous trees that lose leaves)
- Human populations have traditionally adapted by following migrating animal herds or by migrating themselves to follow the rains
The extreme seasonal variation creates challenging conditions for both natural ecosystems and human activities.
Run-off variation and river discharge
Understanding how rivers respond to rainfall is essential for flood management and water resource planning.
Measuring discharge
River flow is measured by calculating discharge - the volume of water passing a measuring point in a given time period. The calculation involves:
Units are typically expressed as cubic metres per second () or cumecs. Direct measurement uses flow gauges, current meters, or automated monitoring stations.
Key terminology for river discharge
Bankfull refers to the maximum discharge a river channel can carry without flooding. When discharge exceeds this threshold, water spills onto the floodplain.
Base flow represents the normal day-to-day discharge of a river. It results from slow-moving soil throughflow and groundwater gradually seeping into the river channel. Base flow keeps rivers flowing during dry periods.
Storm flow is discharge resulting from storm precipitation. It involves rapid inputs from overland flow, throughflow, and groundwater flow combined. Storm flow causes sharp increases in river levels.
Peak discharge is the highest point of discharge on a flood hydrograph - when river flow is at its greatest during a storm event.
Lag time represents the delay between peak rainfall and peak discharge. Shorter lag times indicate faster water movement through the basin, often leading to more severe flooding.
A storm hydrograph is a graph showing river discharge over time during a storm event. It illustrates how the normal flow pattern is affected by the storm, showing the rise to peak discharge and subsequent recession.
Factors affecting discharge
Discharge results from the complex interaction of climatological and geographical factors within a drainage basin. Understanding discharge patterns is crucial for:
- Assessing flood risk and designing flood defences
- Managing irrigation systems for agriculture
- Designing water-related infrastructure (bridges, dams, water treatment facilities)
- Planning water resource allocation during different seasons
Different drainage basins respond differently to rainfall depending on factors like soil type, vegetation cover, slope steepness, and human modifications to the landscape. These characteristics determine how quickly water moves through the basin and reaches river channels.
Remember!
Key Points to Remember:
-
Water balance = : Precipitation equals discharge plus evapotranspiration plus changes in storage. This fundamental equation governs all water movement in drainage basins.
-
Four soil moisture phases: Recharge (filling up), utilisation (being used), deficit (dried out), and surplus (overflowing). These phases determine water availability for rivers, vegetation, and human use.
-
Potential evapotranspiration: This represents the maximum possible water loss if unlimited water was available. It's controlled by temperature and differs from actual evapotranspiration when water is limited.
-
Climate determines water balance patterns: Temperate climates show seasonal surplus and deficit cycles, equatorial climates maintain year-round surplus, whilst tropical wet/dry climates experience extreme seasonal variations with long drought periods.
-
Discharge measurement reveals basin response: Understanding bankfull, base flow, storm flow, peak discharge, and lag time helps predict flooding and manage water resources effectively. Storm hydrographs show how drainage basins respond to rainfall events.