Sample Mean Distribution (AQA A-Level Mathematics): Revision Notes
5.3.1 Sample Mean Distribution
Hypothesis Test for the Sample Mean of a Normal Distribution
Take the random variable:
Consider the situation where we take a random sample of n items from this distribution and then find their mean. Repeat this a large number of times and list out all the means obtained. These will follow a normal distribution.
Example: Give the distribution of for when a sample of 60 items is taken, and the mean of the sample is found.
For the above, find and .
We can use this distribution of means in order to test whether the mean of a normal distribution has changed.
Example It is known that for a certain type of plant, its mean height is 21 cm. A new fertiliser is tested on the plant, and the manufacturer claims that it makes the plant grow taller. A sample of 20 such plants was chosen for testing with the fertiliser, and their mean height was found to be 21.2 cm.
Assuming that unfertilized plants' heights are normally distributed with mean 21 cm and standard deviation 1.5 cm, test at the 5% significance level whether the claim is true.
- Define the parameter that we are testing and state hypotheses:
- = "the mean height of plants" ← Must use , not
- ← No change in mean is default position
- ← If our null hypothesis is proved incorrect, then we have evidence of an increase
- Define sample mean distribution we are testing:
- Perform the test:
-
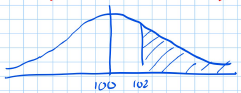
This is called the critical or rejection region. If our observation lies in this region, we reject . Method 1: Finding the critical region
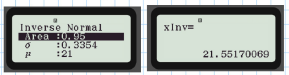
-
Use your calculator in inverse normal mode to find the boundaries of the critical region.
Method 2: Finding probability to the left/right of observed value
- Depending on whether we are testing the right/left tail of the distribution, we calculate the area to the left/right of our observed value.
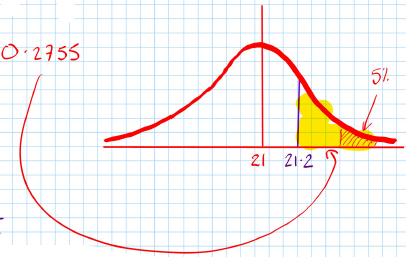
- This says that 27.55% of the total area lies to the right of 21.2, meaning it cannot be in the critical/rejection region.
- Conclude in context Method 1:
Method 2:
Conclusion:
- Accept : Insufficient evidence to suggest that the fertiliser increases the mean.
Example: The mean of a normally distributed population is known to be 5. A claim is made that this is not the mean. To test this, a sample of size 25 is taken, and the mean is found to be 6.1.
Given that the standard deviation of the population is 3, test at the 5% significance level whether the mean has changed from 5.
- Define the parameter that we are testing, not state hypotheses:
- = "the population mean" ⟵ must be in context if question.
- Write out null and alternate hypotheses:
- 5 ⟵ Two-tailed test, so 2.5% sig at each tail.
- Define sample mean distribution we are testing:
- is always the value used in .
- Critical Region Method:
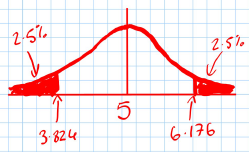
- CR is:
Probability Method:
This probability calculation is sometimes referred to as a p-value.
Accept : Insufficient evidence to suggest that the mean is different from 5 (at 5% significance level).