Capacitor charge and discharge (AQA A-Level Physics): Revision Notes
7.4.4 Capacitor charge and discharge
Exponential Curve
When a capacitor charges or discharges in a circuit, it involves storing or releasing electrical energy. This process follows an exponential curve for current, potential difference, and charge over time.
Here's how it works:
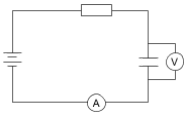
Charging a Capacitor
To charge a capacitor, connect it in a circuit with a power source and resistor. The ammeter () measures the current, and the voltmeter () measures the potential difference across the capacitor.
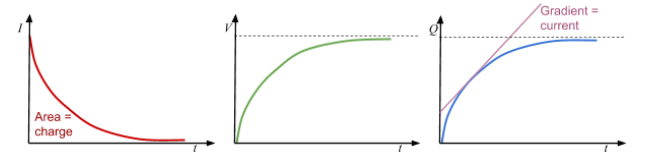
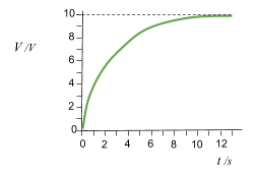
- Graphing Voltage and Current over Time: You can use a data logger to measure the potential difference (voltage) and current over time. These can be plotted on a voltage-time graph and current-time graph.
- Charge-Time Graph: Since , the charge () can be found by calculating the area under the current-time graph.
How Charging Works
- Initial Stage: As the circuit is powered on, electrons accumulate on the plate connected to the negative terminal. On the opposite plate, electrons are repelled, forming a positive charge.
- Potential Difference: As charge builds up, a potential difference is created across the plates, opposing the flow of more electrons. The rate of current decreases over time.
- Completion: Eventually, the potential difference across the capacitor equals that of the power supply, and current drops to zero.
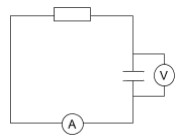
Discharging a Capacitor
To discharge a capacitor, it must be connected in a closed circuit with only a resistor.
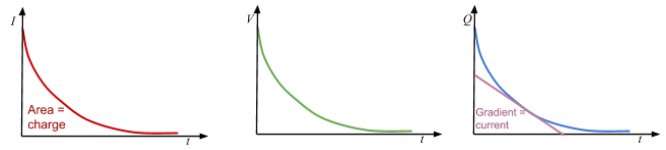
- Voltage, Current, and Charge Decrease Exponentially: The current, charge, and potential difference across the capacitor all decrease exponentially over time.
- Graphing the Discharge: The graphs for voltage, current, and charge against time display exponential decay.
Exponential Equations for Charging and Discharging
For both charging and discharging, exponential equations can be used to model the behaviour of current (), potential difference (), and charge () at any time .
Charging Equations:
- Current:
- Potential Difference:
- Charge:
Discharging Equations:
- Current:
- Potential Difference:
- Charge:
Where:
- , , and are the initial current, voltage, and charge, respectively.
- is the resistance, and is the capacitance.
Time Constant
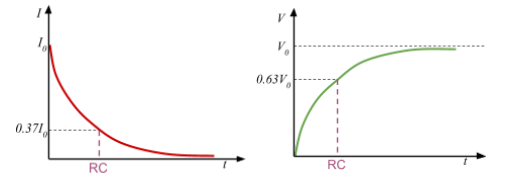
The time constant represents the time taken for a capacitor to charge to 63% or discharge to 37% of its initial value.
- Discharging to 37%: After one time constant , the capacitor will have 37% of its original charge, current, or voltage remaining.
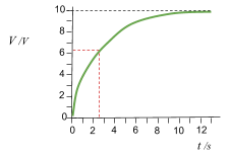
- Charging to 63%: Similarly, for charging, after one time constant, the capacitor reaches 63% of its maximum charge or voltage.
Calculating the Time Constant from Graphs
- Finding 0.37 or 0.63 of the Initial Value: Identify the time where the graph reaches 0.37 or 0.63 of its starting value. This time equals .
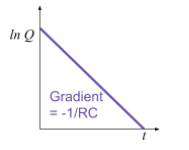
- Log Graphs: By taking the natural logarithm () of both sides of the discharge equation, you can transform the exponential curve into a linear relationship:
- The gradient of vs. graph is .
Time to Halve (Half-Life)
The half-life is the time it takes for the charge, current, or potential difference to fall to half of its initial value.
Derivation:
- Use the equation .
- Taking natural logs of both sides, solve for :
- 0.69 Therefore,
Worked Example
Example: A capacitor with a capacitance of 300 μF is discharged through a 400 kΩ resistor. The initial charge is 5 C. Find the charge remaining after 5 seconds.
- Use the formula .
- Substitute values:
- After 5 seconds, approximately 4.8 C of charge remains on the capacitor.