Price Determination and the Price Mechanism (Edexcel A-Level Economics A): Revision Notes
Price Determination and the Price Mechanism
Introduction: the coordination problem
All societies face the fundamental economic problem of scarcity. With unlimited wants but limited resources, difficult decisions must be made about which goods and services to produce, how to produce them, and for whom they should be produced. In a large economy like the UK, this creates an immense coordination problem. The key question is: how can consumers communicate their preferences for different goods so that producers can create the best mix of goods and services?
Different economic systems approach this challenge in different ways. In a completely free market economy, market forces are allowed to allocate resources without government interference. At the opposite extreme, in a centrally planned economy, the state plans and directs resources into various uses. Most modern economies fall somewhere between these extremes, operating as mixed economies. In free market economies, prices play the crucial coordinating role. This approach is sometimes called the laissez-faire approach to resource allocation, where market forces operate with minimal government intervention.
The term laissez-faire comes from French, meaning "let do" or "leave alone." It represents an economic philosophy where markets operate with minimal government intervention, allowing the invisible hand of market forces to guide resource allocation.
Consumer surplus
Understanding the demand curve and consumer valuations
The demand curve represents more than just the quantity people want to buy at different prices. It actually shows the valuations that consumers place on a good, reflecting the satisfaction they gain from consuming it. Consider the market for smartphones. When a price is set at , the quantity demanded is . This price represents the satisfaction derived from consuming the good for the marginal consumer - the last person willing to buy at that price. It reflects what just induces them to purchase a smartphone.
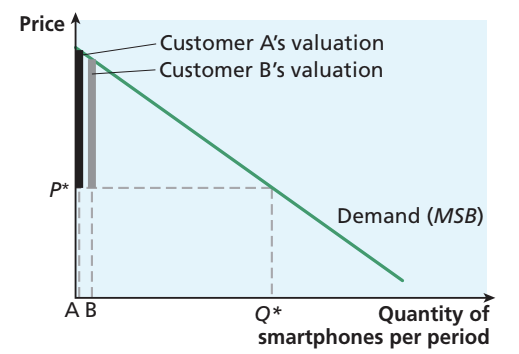
In most markets, all consumers face the same prices for goods and services. This creates an important economic concept. The price may represent the value of smartphones to the marginal consumer, but what about all the other consumers who are buying smartphones at this price? Many of them would be willing to pay a higher price. For instance, Consumer A in the diagram above would pay a very high price for a smartphone because they value it much more highly than . When Consumer A pays for a smartphone, they get a great deal, as they value the good so much more highly than the price they actually pay. This difference between what they're willing to pay and what they actually pay is shown by the vertical distance on the diagram. Consumer B also gains a surplus above their willingness to pay.
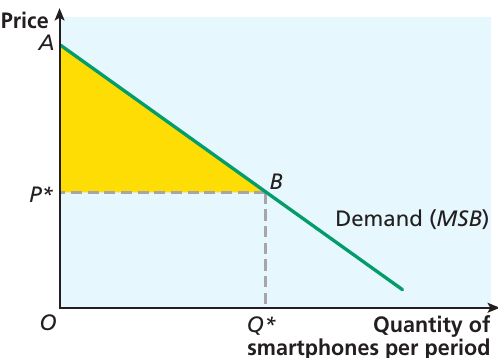
When all these individual surplus values are added up across all consumers in the market, they sum to the total surplus that society gains from consuming smartphones. This is known as consumer surplus, represented by the shaded triangular area above the price line and below the demand curve. It shows the welfare that society gains from consuming the good, over and above the price that has to be paid for it.
Key term: Consumer surplus is the value that consumers gain from consuming a good or service over and above the price paid.
Marginal social benefit
Looking at the market as a whole, we can think of the price as the benefit that society gains from consuming the last unit of the good. This can be described as the marginal social benefit (MSB) derived from consuming the good. This term reflects that the demand curve itself can be interpreted as showing the marginal social benefit to be derived from consuming different quantities of the good. At any point along the demand curve, the price shows society's marginal benefit from that unit.
Key term: Marginal social benefit (MSB) is the additional benefit that society gains from consuming an extra unit of a good.
The relationship between consumer surplus and price
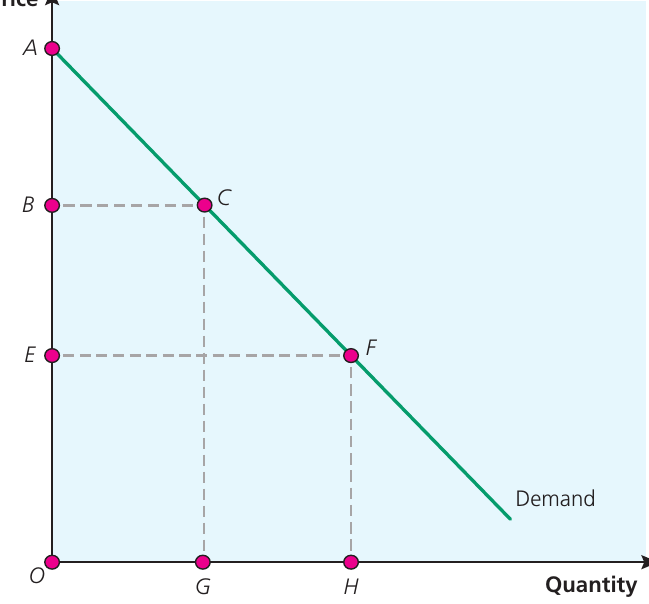
There is a clear relationship between the size of consumer surplus and the price charged for a good. If the price of a good increases, this will reduce the overall size of consumer surplus and affect the welfare that society receives from consuming the good. Looking at the diagram above, when the price is relatively low at , quantity demanded is . Consumers spend the area , and they receive consumer surplus of . However, if the price were to increase to , quantity demanded would fall to . Spending would be the area , and consumer surplus would be lower than before, at .
Worked Example: Price Changes and Consumer Welfare
Suppose there is an increase in the price of cinema tickets from $10 to $15.
Impact on consumers:
- Some people will not go to the cinema as frequently as before (quantity demanded falls)
- Those who do go at the higher price will receive less consumer surplus than if the price had remained at $10
- Overall welfare has fallen
The extent of the impact depends upon the shape of the demand curve and consumer responsiveness to price changes (price elasticity of demand).
Producer surplus
Understanding the supply curve
Parallel to the notion of consumer surplus is the concept of producer surplus. The supply curve reveals how much output firms are prepared to supply at any given price in a competitive market. It shows the minimum price at which firms would be willing to supply different quantities.
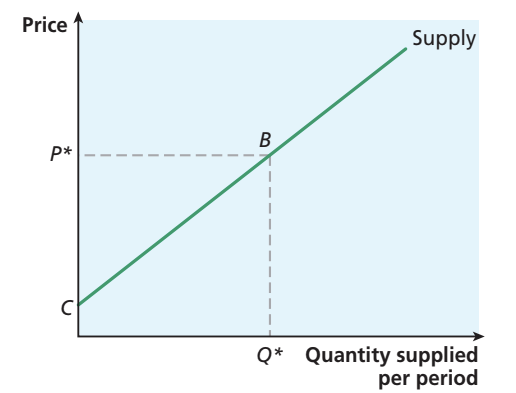
Assume the market price is at and that all units are sold at that price. represents the value to firms of the marginal unit sold. In other words, if the price had been set slightly below , the last unit would not have been supplied, as firms would not have found this profitable.
Key term: Producer surplus is the difference between the price received by firms for a good or service and the price at which they would have been prepared to supply that good or service.
Calculating producer surplus
The threshold at which a firm decides it is not profitable to supply is the point at which the price received by the firm reaches the cost of producing the last unit of the good. The supply curve therefore shows that in the range of prices between point C and , firms would have been willing to supply positive amounts of this good or service. At , they gain a surplus value on all units of the good supplied below .
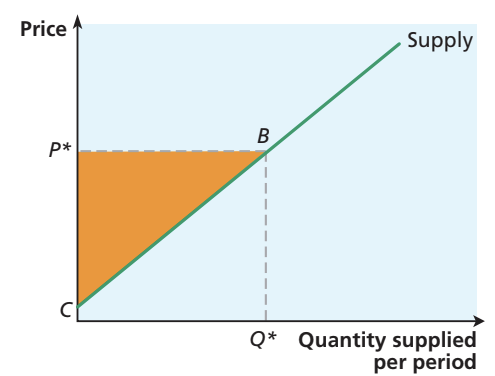
The total producer surplus area is shown in the diagram above - it is the area above the supply curve and below , shown as the shaded triangle . This represents the surplus earned by firms over and above the minimum that would have kept them in the market. Producer surplus is a key objective of firms, as it represents their earnings beyond their costs.
Producer surplus from different perspectives
Let's consider a practical example. The table below shows the price at which each of six consumers would be prepared to buy a good:
| Consumer | A | B | C | D | E | F |
|---|---|---|---|---|---|---|
| Price | $20 | $18 | $16 | $14 | $12 | $10 |
Worked Example: Calculating Consumer Surplus
If the market price is set at $14, consumers A, B, C, and D would choose to buy the good.
Individual surpluses:
- Consumer A receives surplus of $6 ($20 - $14)
- Consumer B receives surplus of $4 ($18 - $14)
- Consumer C receives surplus of $2 ($16 - $14)
- Consumer D receives no surplus ($14 - $14 = $0)
Total consumer surplus: $6 + $4 + $2 + $0 = $12
This shows that even though all consumers pay the same price, those with higher willingness to pay receive greater individual benefits from the transaction.
Market equilibrium and total welfare
Combining consumer and producer surplus
Consumer and producer surplus can be shown together on the same diagram to illustrate the total welfare generated in a market at equilibrium.
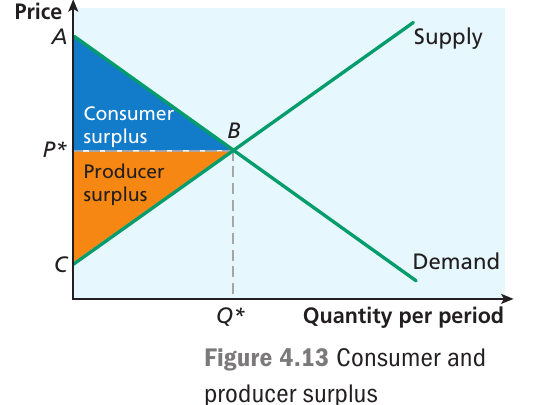
The diagram shows a market in equilibrium, with price at and quantity traded at . The shaded area shows consumer surplus - the benefit consumers receive above what they pay. The area represents producer surplus - the benefit producers receive above their minimum supply price. Together, these two areas represent the total welfare that society gains from the production and consumption of this good. This is an important measure of how well a market is functioning.
The combined area of consumer and producer surplus represents the net benefit to society from market activity. When markets are functioning efficiently, they maximize this total welfare, creating value for both consumers and producers simultaneously.
Effects of changes in demand on welfare
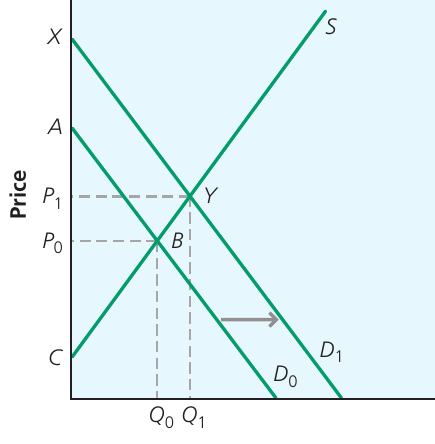
A change in the conditions of demand or supply will affect the size of consumer and producer surplus. The diagram above illustrates the effect of an increase in demand, where consumers are now willing to buy more of a good at any given price. The initial demand curve is given by and the supply curve is . The initial equilibrium price is and the quantity traded is .
When demand shifts to , there is an extension in supply, and equilibrium price increases to with the quantity increasing to . Consumer surplus is now and producer surplus is . Both consumers and producers receive a higher surplus than before, which makes sense because consumers now value the good more highly and are willing to pay more for it.
Effects of changes in supply on welfare
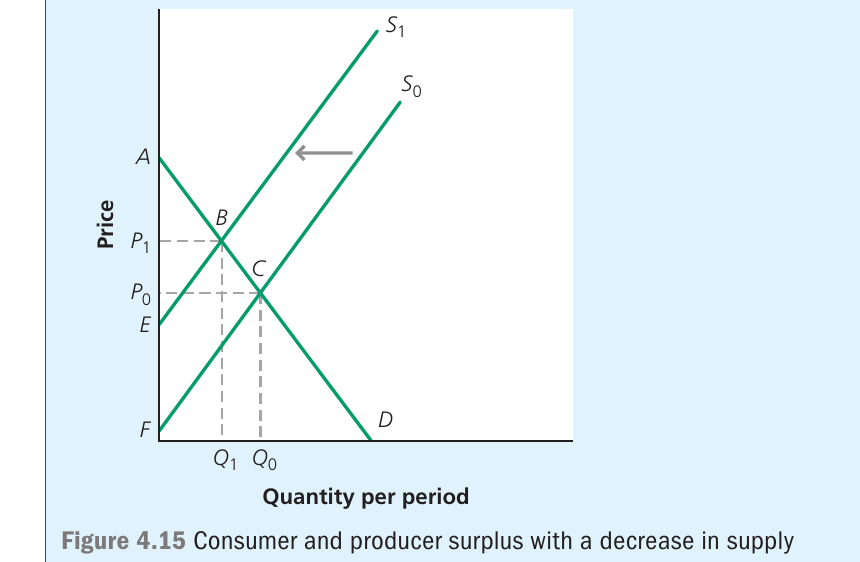
Similarly, changes in supply conditions affect welfare in the market. The diagram shows the effect of a decrease in supply, caused by an increase in production costs. The supply curve shifts leftward from to . This leads to a new equilibrium at point B, with a higher price () and lower quantity () compared to the original equilibrium at point C (, ).
The decrease in supply reduces both consumer and producer surplus. Consumers face higher prices and can purchase less, reducing their surplus from area to area . The impact on producer surplus is more complex - while producers receive a higher price, they sell fewer units and face higher costs. The change in producer surplus depends on the relative sizes of these effects.
When supply decreases, the effect on producer surplus is ambiguous. Producers benefit from higher prices but lose from reduced sales volume and potentially higher production costs. The net effect depends on the elasticity of demand and the magnitude of the cost increase.
Prices and preferences
How consumers signal preferences
How can consumers signal their preferences to producers? Demand and supply analysis provides the answer. Consider the market for smartphones over time. There has been a rightward shift in the demand curve, indicating that consumers are placing a higher value on these goods and are prepared to demand more at any given price.
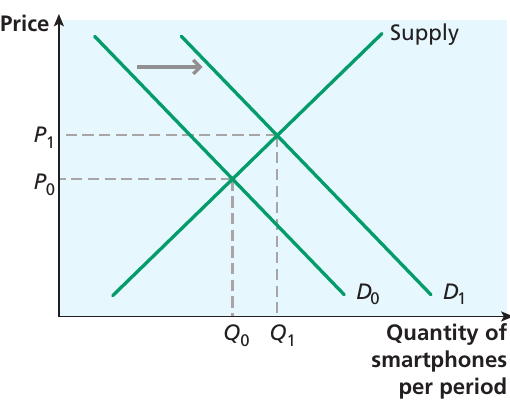
When demand increases from to , the market moves to a new equilibrium with price rising from to and quantity traded increasing from to . There is a movement along the supply curve as producers respond to the higher price. This shift in the demand curve is an expression of consumers' preferences - it embodies the fact that they value smartphones more highly now than before. The price that consumers are willing to pay represents their valuation of smartphones.
Decreasing demand and market signals
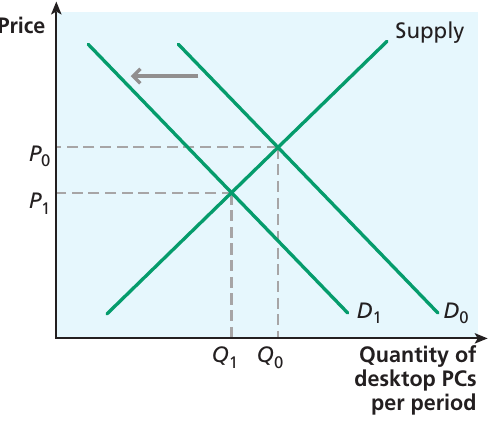
The price signal works equally well when there is a decrease in demand for a good or service. The diagram shows the market for desktop PCs. With the growth of tablets and laptops, there has been a fall in the demand for desktop PCs, so the demand curve has shifted to the left - consumers are demanding fewer desktop PCs at any price. The demand curve shifts from to .
Producers of desktop PCs find that they cannot sell as many desktop PCs at the original price as before, so they have to reduce their price to avoid an increase in their unsold stocks. They have less incentive to produce desktop PCs and will supply less. There is a contraction of supply, leading to a lower equilibrium price at and a lower quantity traded at .
Market signals work in both directions. When demand increases, rising prices signal producers to supply more. When demand falls, lower prices signal producers to reduce production. This two-way communication is central to how free markets coordinate economic activity.
The price mechanism
Definition and functions
Resource allocation is influenced by the operation of the price mechanism through rationing, incentives and signalling.
Key term: Price mechanism is a process by which resource allocation is influenced through rationing, incentives and signalling.
In a free market, where there is excess demand, consumers are rationed because the equilibrium price will rise to choke off the excess demand - so some consumers will not get to buy the good. This is the rationing function of price.
Signalling function
From the producers' perspective, the question is how they receive signals from consumers about their changing preferences. Price is the key. When there is an increase in demand for smartphones, this leads to an increase in the equilibrium market price. The shift in the demand curve leads to an increase in the equilibrium price, which encourages producers to supply more smartphones - there is an extension of supply. This is saying that producers find it profitable to expand their output at that higher price. The price level is thus a signal to producers about consumer preferences.
Key term: Price signal is where the price of a good carries information to producers or consumers that guides the market towards equilibrium and assists in resource allocation.
Incentives function
Notice that the price signal works both ways. Firms receive signals from consumers about changing preferences, but in similar fashion, prices act as a rationing device if firms are unable to supply the goods that consumers want to buy. For example, suppose there is a poor harvest of coffee because of adverse weather conditions in Brazil. The equilibrium price will rise, and consumers will find themselves rationed - some will have to go without or reduce their consumption.
Key term: Marginal cost is the cost of producing an additional unit of output.
The threshold at which a firm will decide it is not profitable to supply is the point at which the price received by the firm reaches the cost of producing the last unit of the good. If the price is higher than the cost of an extra unit, the firm will make a profit by producing it. The cost of producing an additional unit of a good is known by economists as the marginal cost. In a competitive market, the supply curve reflects that marginal cost.
The Three Functions of the Price Mechanism:
- Signalling: Prices convey information about consumer preferences and production costs, guiding both producers and consumers in their decisions
- Incentives: Price changes motivate producers to increase or decrease production and consumers to buy more or less
- Rationing: When demand exceeds supply, higher prices ensure that goods go to those who value them most highly
Desirable market outcomes
From the point of view of society as a whole, an important question is whether a market produces a desirable outcome. The price can be seen as the marginal social benefit that consumers receive from consuming a good. If the price is also equal to the marginal cost of producing the good, this suggests that the market outcome is indeed favourable for society. After all, if the marginal cost of producing a good was greater (or lower) than the marginal benefit, this would suggest that the market would not be producing the quantity of the good that corresponds to consumer preferences.
Entry and exit of firms
Short-run and long-run adjustments
The discussion so far has focused on the reactions of existing firms in a market to changes in consumer preferences. However, this is only part of the picture. Consider what happens when there is an increase in demand for smartphones following a change in consumer preferences.
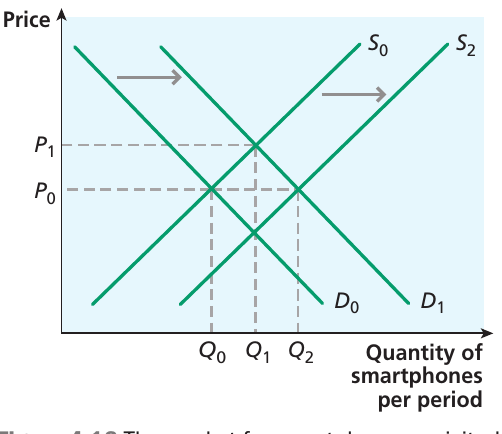
In the diagram, the initial situation shows demand curve and supply curve , with equilibrium at price and quantity . When demand increases to , the equilibrium price rises to and existing firms expand the quantity supplied in response to . Those firms are now earning a higher producer surplus than before.
Other firms not currently in the market will be attracted by these surpluses, perceiving this to be a profitable market in which to operate. If firms are free to enter the market, they will do so. This in turn will tend to shift the supply curve to the right (to ), as there will then be more firms prepared to supply. As a result, the equilibrium market price will tend to drift down again, until the market reaches a position in which there is no further incentive for new firms to enter the market.
This will occur when the rate of return for firms in the smartphone market is no better than in other markets. The diagram shows this final position, where the new supply curve intersects with demand curve at price but with quantity traded now at .
Worked Example: Market Adjustment Over Time
Initial situation:
- Demand increases for smartphones (shift from to )
- Price rises from to
- Existing firms expand production to
Short-run response:
- Existing firms earn higher producer surplus
- Market operates along original supply curve
Long-run adjustment:
- New firms enter the market, attracted by higher profits
- Supply curve shifts right (from to )
- Price falls back toward
- Quantity increases further to
Final equilibrium:
- Price returns to original level ()
- Quantity traded is higher () due to more firms in the market
- Profits normalize across industries
Exit from markets
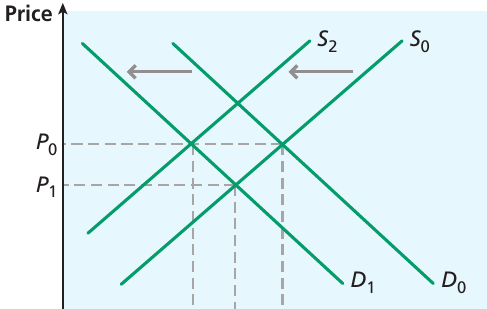
If the original movement in demand is in the opposite direction, as it was for desktop PCs, a similar long-run adjustment takes place. As the market price falls, some firms in the market may decide that they no longer wish to remain in production and will exit from the market altogether.
This will shift the supply curve to the left until only firms that continue to find it profitable will remain in the market. In the final position, price is back at and quantity traded has fallen to .
These long-run adjustments are crucial for understanding how markets work. In the short run, existing firms adjust their output levels along the supply curve. In the long run, firms enter into markets (or exit from them) in response to the relative profitability of various economic activities. This helps to ensure that firms produce the range of goods that consumers wish to buy.
The working of a market economy
The role of opportunity cost
The price mechanism allows a society to allocate its resources effectively if firms respond to changes in prices. Consumers express changes in their preferences by their decisions to buy (or not to buy) at the going price, which leads to a change in the equilibrium price. Firms thus respond to changes in consumer demand, given the incentive of profitability, which is related to price. In the short run, existing firms adjust their output levels along the supply curve. In the long run, firms enter into markets (or exit from them) in response to the relative profitability of the various economic activities that take place in the economy.
One way of viewing this system is through the notion of opportunity cost. In choosing to be active in the market for desktop PCs, a firm faces an opportunity cost. If it uses its resources to produce desktop PCs, it is not using those resources to produce something else. There may come a point at which the cost of producing desktop PCs becomes too high, if the profitability of other goods is so much higher than that for desktop PCs because of changes in the pattern of consumer demand. When the firm finds that it is not covering its opportunity costs, it will transfer production away from the desktop PC market.
Opportunity cost is a driving force in market economies. Firms constantly evaluate whether their resources could earn higher returns elsewhere. This ongoing reallocation of resources toward more profitable activities ensures that the economy responds dynamically to changing consumer preferences.
The government's role and property rights
The government's role in a free economy is relatively limited, but nonetheless important. A basic framework of property rights is essential, together with a basic legal framework. Property rights give legal ownership or control over a good to an individual or entity. Without having legal ownership of a good, an individual is not able to sell it as a market transaction.
A role of the state is to establish a legal system that allows such ownership rights to exist; otherwise, markets could not function. Secure property rights are significant, as this assures the incentives for the owners of capital. Within such a system, consumers try to maximise the satisfaction (utility) they gain from consuming a range of products, and firms seek to maximise their profits by responding to consumer demand through the medium of price signals.
Property rights are fundamental to market economies because they:
- Allow individuals and firms to own and control resources
- Enable market transactions through secure ownership
- Provide incentives for investment and innovation
- Form the legal basis for contracts and exchange
- Protect both buyers and sellers in market transactions
Adam Smith and market economies

It is worth noting that Adam Smith, one of the founding fathers of economics, also sounded a word of warning about free markets. He felt that there were too many factors that interfered with the free market system, such as over-protectionism and restrictions on trade. At the same time, he was not utterly convinced that a free market economy would be wholly effective, noting that firms might at times collude to prevent the free operation of the market mechanism:
People of the same trade seldom meet together, even for merriment and diversion, but the conversation ends in a conspiracy against the public, or in some contrivance to raise prices...
This observation highlights that there may be situations in which consumer interests need to be protected, if there is some sort of market failure that prevents the best outcome from being achieved. Free markets do not always lead to the best possible allocation of resources - there may be market failure, which is explored in later chapters.
Adam Smith's warning remains relevant today. While market forces can efficiently allocate resources, markets may fail when:
- Firms collude to fix prices or restrict competition
- Information is asymmetric between buyers and sellers
- Externalities affect third parties
- Public goods are under-provided
- Market power is concentrated in few hands
These situations may require government intervention to protect consumer interests and ensure efficient outcomes.
Remember!
Key Points to Remember:
-
Consumer surplus represents the welfare gain that consumers receive from purchasing goods at prices below their maximum willingness to pay. It is shown as the triangular area below the demand curve and above the market price.
-
Producer surplus is the benefit firms gain by selling goods at prices above their minimum supply price. It appears as the triangular area above the supply curve and below the market price.
-
The price mechanism coordinates resource allocation through three key functions:
- Signalling: conveying information about preferences and costs
- Incentives: motivating producers and consumers to respond to price changes
- Rationing: allocating scarce resources when demand exceeds supply
-
Markets adjust through price changes in the short run and through firm entry and exit in the long run, moving towards equilibrium where the interests of consumers and producers align.
-
For markets to function effectively, a framework of property rights and basic legal institutions is essential, allowing secure ownership and exchange of goods and services.
-
Opportunity cost drives resource allocation, as firms constantly evaluate whether their resources could earn higher returns in alternative uses.
-
While free markets can efficiently allocate resources, market failures may occur, requiring government intervention to protect consumer interests and ensure optimal outcomes.