Venn Diagrams (Edexcel A-Level Mathematics): Revision Notes
3.1.2 Venn Diagrams
Venn diagrams are a visual tool used to represent the relationships between different sets of data. They are especially useful in set theory, probability, and logic to show how different groups or sets overlap and interact with each other.
Components of a Venn Diagram
- Circles: Each circle represents a set. The elements (or members) of the set are usually placed inside the circle.
- Intersection: The area where two or more circles overlap represents the elements that are common to those sets.
- Union: The area covered by all circles combined represents all the elements that are in any of the sets.
- Complement: The area outside a particular circle represents the elements not in that set.
Example with Two Sets: Let's consider two sets:
-
Set A: Students who play football.
-
Set B: Students who play basketball. A Venn diagram with these two sets would have two circles:
-
Circle A: Represents all students who play football.
-
Circle B: Represents all students who play basketball.
-
The overlapping area (intersection) represents students who play both football and basketball.
Notation
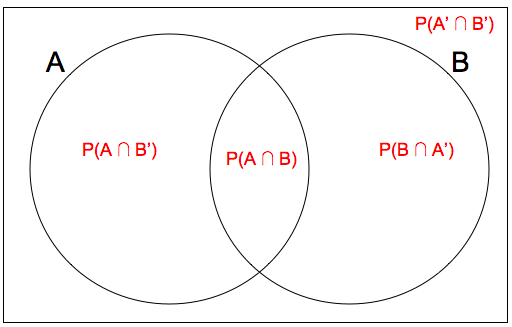
- Union : The set of elements that are in A, B, or both. This is represented by the entire area covered by both circles.
- Intersection : The set of elements that are in both A and B. This is represented by the overlapping area of the circles.
- Complement : The set of elements that are not in A. This is the area outside circle A.
Example: Suppose:
- Set A: {}
- Set B: {}
- Union : {}
- Intersection : {}
- Complement of A : All elements not in set A (this could depend on the universal set, which might be, say, {}.
Venn Diagrams with Three Sets
When dealing with three sets (A, B, and C), the Venn diagram consists of three overlapping circles. This allows you to represent the intersection of any combination of the sets.
Example: Let's say:
-
Set A: Students who play football.
-
Set B: Students who play basketball.
-
Set C: Students who play tennis. The Venn diagram will show:
-
The areas where only A and B overlap (students who play both football and basketball, but not tennis).
-
The areas where only B and C overlap (students who play both basketball and tennis, but not football).
-
The areas where all three sets overlap (students who play football, basketball, and tennis).
Practical Uses
- Probability: Venn diagrams help in visualising and calculating the probability of combined events.
- Set Theory: They are fundamental in understanding operations like union, intersection, and difference of sets.
- Logic and Reasoning: Venn diagrams are used to illustrate logical relationships and test the validity of arguments.
Example: Consider the following data:
-
students play football.
-
students play basketball.
-
students play both football and basketball. To represent this in a Venn diagram:
-
Draw two overlapping circles.
-
Place in the intersection (students who play both).
-
Place in the football-only part of the football circle.
-
Place in the basketball-only part of the basketball circle.
Explanation:
- The Venn diagram helps understand and calculate the number of students who play only one sport or both.
- Venn diagrams are powerful tools for visualising relationships between sets and simplifying complex problems, especially in probability and logical reasoning.
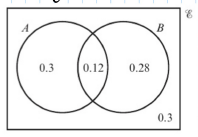
Conditional Probabilities from Venn Diagrams
Example Questions
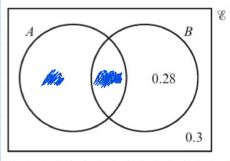
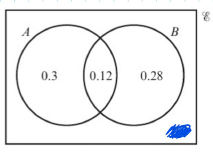
A Venn diagram is provided with probabilities for two events A and B.
The tasks are to find the following probabilities:
- a)
- b)
- c)
- d)
Worked Solutions
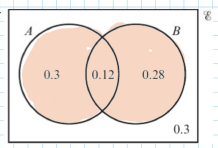
- Finding :
This represents the probability that either event or or both occur.
b. Finding :
means "the probability that occurs, given that occurs."
Given B has occurred, the denominator is the sum of the probabilities in event B.
This is also shown using the formula for conditional probability:
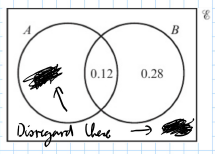
c. Finding :
means the probability that occurs given that does not occur.
d. Finding :
First, calculate the probability of the intersection of B with :
Then, calculate the probability of :
Finally, apply the formula for conditional probability:
This gives the final answer as .